SECURITIES AND EXCHANGE COMMISSION
Washington, D.C. 20549
SCHEDULE 14A INFORMATION
Check the appropriate box:
|
|
o | Preliminary Proxy Statement |
o | Confidential, for Use of the Commission Only (as permitted by Rule 14a-6(e)(2)) |
x | Definitive Proxy Statement |
o | Definitive Additional Materials |
o | Soliciting Material Pursuant to Sec. 240.14a-12 |
|
FIRST HORIZON NATIONAL CORPORATION |
|
(Name of Registrant as Specified in Its Charter) |
|
(Name of Person(s) Filing Proxy Statement, if other than the Registrant) |
Payment of Filing Fee (Check the appropriate box): | |
|
|
x | No fee required. |
o | Fee computed on table below per Exchange Act Rules 14a-6(i)(1) and 0-11. |
|
|
1) | Title of each class of securities to which transaction applies: |
|
|
| |
2) | Aggregate number of securities to which transaction applies: |
|
|
| |
3) | Per unit price or other underlying value of transaction computed pursuant to Exchange Act Rule 0-11:* |
|
|
| |
|
|
4) | Proposed maximum aggregate value of transaction: |
|
|
5) | Total fee paid: |
|
|
o | Fee paid previously with preliminary materials. |
|
|
o | Check box if any part of the fee is offset as provided by Exchange Act Rule 0-11(a)(2) and identify the filing for which the offsetting fee was paid previously. Identify the previous filing by registration statement number, or the form or schedule and the date of its filing. |
1) | Amount previously paid: |
|
|
2) | Form, Schedule or Registration Statement No.: |
|
|
3) | Filing Party: |
|
|
4) | Date Filed: |
|
|
| |
*Set forth the amount on which the filing fee is calculated and state how it was determined. | |
![]()
![]()
March 13, 201712, 2018
Dear Fellow Shareholder:
You are cordially invited to attend First Horizon National Corporation’s 20172018 annual meeting of shareholders. We will hold the meeting on April 25, 2017 in24, 2018 at the Auditorium, First Tennessee First Ops Building, 165 Madison Avenue,3451 Prescott Road, Memphis, Tennessee 38118, at 10:00 a.m. local time.
Our strategic and operating results in 20162017 were excellent.outstanding. We experienced exceptional loancompleted three acquisitions, growing our total assets to $41 billion and becoming the fourth largest regional bank in the Southeast, with over 800,000 customers and more than 300 branches in Tennessee, North Carolina, South Carolina, Florida, Mississippi, Georgia, Texas and Virginia. Loan and deposit growth was exceptional across First Tennessee. WeTennessee, and we retained our No. 1 deposit market share in Tennessee and continued to grow organically in our other markets. We expanded our specialtyFirst Horizon continued to receive recognition as a great banking businesses by attracting top bankers in franchise finance, healthcare finance, music industry bankingorganization and structured equipment finance.a great place to work. Highlights include:
| • | |
| • | |
| • | Completed the acquisition of Coastal Securities, a national leader in the trading, securitization and analysis of Small Business Administration loans, and of Profession Mortgage Company, a leading provider of institutional debt capital and commercial mortgage loan servicing. |
| • | Annual common dividend rate increased |
| • | Consolidated |
| • | Regional |
| • | |
As we mark our 153rd154th year, our Firstpower culture, with its emphasis on Accountability, Adaptability, Integrity and Relationships, continues to help us meet the challenges that we face. The strength of our culture and the quality of our people were reaffirmed with top-employer recognition from Fortune, American Banker, Working Mother, the National Association for Female Executives, the Human Rights Campaign, the Dave Thomas Foundation for Adoption, and the Profiles in Diversity Journal. As a result of the recently passed tax reform bill and in recognition of the
outstanding performance of our employees, we were happy to award $1,000 bonuses to approximately 70% of our employees at the end of 2017 and increase the minimum pay level of our employees to $15 an hour early in 2018.
We striveFirst Horizon strives to make a positive difference in ourthe communities viawe serve through the First Tennessee Foundation which made nearly $5 million in grants and matching gifts in 2016, as well as our newly created $50 millionthe First Tennessee Community Development Fund. Together the Foundation and the Community Development Fund which will award upinvested nearly $11 million in our communities in 2017 alone. Through our partnership with financial literacy organization Operation HOPE, our Education & Empowerment Program provides financial education to $3 million annuallyyouth, adults and small businesses to improve financial health in grants to organizations serving low- to moderate-income people and neighborhoods. One of our newest contributions is offeringthe communities we serve. More than 8,000 participants have received free financial empowerment education and one-on-one credit counseling through our collaboration with Operation13 HOPE and we expect to have 15 Operation HOPE locations in branches across our markets by the end of 2017.Inside locations.
Accompanying this letter are the formal notice of the annual meeting, our 20172018 proxy statement and our annual report to shareholders, which contains detailed financial information relating to our activities and operating performance during 2016.2017. Though it is being delivered to you with our proxy statement, the annual report to shareholders is not “soliciting material” under SEC Regulation 14A.
At the meeting, we will ask you to elect eleventwelve directors; to vote on technical amendments to modernize the Company’s Restated Charter; to vote on an advisory resolution to approve executive compensation (“say on pay”); to vote on an advisory proposal to determine the frequency (whether every year, every two years or every three years) of future say on pay votes; and to ratify the appointment of KPMG LLP as our independent auditors for 2017.2018. The accompanying proxy statement contains information about these matters.
Your vote is important. You may vote your proxy by telephone, over the internet or, if you received a paper proxy card by mail, you may also vote by signing, dating, and returning the proxy card by mail (as directed on the proxy card). Even if you plan to attend the meeting, please vote your proxy by telephone or over the internet or return your proxy card as soon as possible.
Thank you for your continued support of First Horizon, and I look forward to seeing you at the annual meeting.


D. Bryan Jordan
Chairman of the Board,
President and Chief Executive Officer
NoticeNotice of Annual Shareholders’ Meeting Annual Shareholders’ Meeting
April25, 2017April 24, 2018
10:00 a.m. Central Time
10:00a.m.Central Time
The annual meeting of the holders of First Horizon National Corporation’s common stock will be held on April 25, 2017,24, 2018, at 10:00 a.m. local time inat the Auditorium, First Tennessee First Ops Building, 165 Madison Avenue,3451 Prescott Road, Memphis, Tennessee.Tennessee 38118.
The items of business are:
| 1. | Election of | |
| 2. | Vote on | |
| 3. | Vote on an advisory | |
| 4. | Ratification of the appointment of auditors. |
These items are described more fully in the following pages, which are made a part of this notice. The close of business on February 24, 201723, 2018 is the record date for the meeting. All holders of record of First Horizon’s common stock as of that time are entitled to vote at the meeting. The holders of First Horizon’s depositary shares, each representing a 1/4000th interest in a share of non-cumulative perpetual preferred stock, Series A, issued by First Horizon on January 31, 2013, are not entitled to vote at the meeting, but are entitled under the Tennessee Business Corporation Act to receive this notice of the meeting (which states that one of the purposes of the meeting is to consider the proposed amendments to the Restated Charter) and a copy or summary of the proposed amendments.
Management requests that you vote your proxy by telephone or over the internet or that you sign and return the form of proxy promptly, as applicable, so that if you are unable to attend the meeting your shares can nevertheless be voted. You may revoke a proxy at any time before it is exercised at the annual meeting in the manner described on page 5 of the proxy statement.


Clyde A. Billings, Jr.
Senior Vice President, Assistant General Counsel
and Corporate Secretary
Memphis, Tennessee
March 13, 201712, 2018
IMPORTANT NOTICE
Please (1) vote your proxy by telephone (2) vote your proxy over the internet or (3) mark, date, sign and promptly mail the form of proxy, as applicable, so that your shares will be represented at the meeting.
If you hold your shares in street name, it is critical that you instruct your broker or bank how to vote if you want your vote to count in the election of directors, the amendments to the Restated Charter, and the advisory resolution to approve executive compensation and the advisory proposal to determine the frequency of the say on pay vote (Vote Item Nos. 1, 2 and 3 of this proxy statement). Under current regulations, if you hold your shares in street name and you do not instruct your broker or bank how to vote in these matters, no votes will be cast on your behalf with respect to these matters. For additional information, see page 6 of the proxy statement.
Proxy Statement for 20172018 First Horizon National Corporation Annual Meeting
Table of Contents
| Page | |||
| Outstanding Director Equity Awards at Year-End | |||
| Director Options Exercised & Stock Vested | |||
| Legal Matters | 85 | ||
| Section 16(a) Beneficial Ownership Reporting Compliance | |||
| Page | ||
| APPENDIX | ||
| A—Audit Committee Charter | A-1 | |
| B—Sections of Restated Charter Proposed to Be Amended | B-1 | |
| C—Reconciliation of Non-GAAP to GAAP Financial Information | C-1 | |
Please read the entire proxy statement before voting. This summary highlights information contained elsewhere in this proxy statement and does not contain all of the information that you should consider. Page references are supplied to help you find further information in the proxy statement.
Vicki R. Palmer
| Ms. Palmer is the President of The Palmer Group, LLC, Atlanta, Georgia, a general consulting firm. Between 2004 and 2009, she served as Executive Vice President, Financial Services and Administration, Coca-Cola Enterprises Inc. (“CCE”), Atlanta, Georgia, a bottler of soft drink products. She was responsible for overseeing treasury, pension and retirement benefits, asset management, internal audit and risk management, was a member of CCE’s Risk Committee, served on CCE’s Senior Executive Committee and had oversight responsibility for CCE’s enterprise-wide risk assessment process.
Skills and Expertise:
• Expertise in public company finance, risk management and administration
• Senior level policy-making experience at a public company
• Knowledge of public company audit and governance matters due to public company board service
Other Current Public Company Board Service:Haverty Furniture Companies Inc. (since 2001)
Non-Profit Board Service: Serves on the boards of several non-profit organizations. | |
| President of The Palmer Group, LLC | ||
| Independent director since 1993 | ||
| Age 64 | ||
Committees: Compensation (chair), Executive & Risk |
| 32 |
| VOTE ITEM NO. 1—ELECTION OF DIRECTORS |
Colin V. Reed
| Mr. Reed is the Chairman of the Board and Chief Executive Officer of Ryman Hospitality Properties, Inc. (“Ryman”), Nashville, Tennessee, a real estate investment trust. Ryman is the successor by merger to Gaylord Entertainment Company (“Gaylord”), a diversified hospitality and entertainment company whose conversion to a real estate investment trust and subsequent merger into Ryman was led by Mr. Reed. Mr. Reed was elected Chairman of the Board of Gaylord in 2005 and Chief Executive Officer in 2001.
Skills and Expertise:
• Leadership experience at a public company
• Extensive experience in finance and accounting as well as employee matters, mergers and acquisitions, risk assessment, civic affairs, government relations, corporate governance, securities markets and compliance and similar matters associated with leadership positions at public companies
• Knowledge of public company matters due to public company board service
• Nashville resident
Other Current Public Company Board Service: Ryman Hospitality Properties, Inc. (since 2001)
Prior Public Company Board Service: Rite Aid Corporation (2003-2005) | |
| Chairman of the Board and Chief Executive Officer of Ryman Hospitality Properties, Inc. | ||
Independent director
Lead director | ||
| Age 70 | ||
Committees: Compensation, Executive & Risk (chair) |
Cecelia D. Stewart
|
Skills and Expertise:
• Extensive experience in banking and financial services
• Senior level policy-making experience at a public company
• Experience in employee matters, finance and accounting, risk assessment, and similar matters associated with running a large division of a public company
• Knowledge of public company executive compensation, information technology and other matters due to public company board service
Other Current Public Company Board Service: United States Cellular Corporation (since 2013)
Non-Profit Board Service: Serves on the board of a non-profit organization. |
U.S. Consumer and Commercial Banking of Citigroup, Inc. | |
| Independent director since 2014 | |
| Age | |
Committees: Audit, Information Technology |
| 33 |
| VOTE ITEM NO. 1—ELECTION OF DIRECTORS |
| Rajesh Subramaniam | Mr. Subramaniam is
Skills and Expertise:
• Senior level policy-making experience at a public company
• In-depth experience in marketing, public relations, communications, crisis management, corporate strategy, global pricing and revenue management, customer experience, portfolio management and innovation
• Expertise in information technology, including leadership of digital transformation
• Memphis resident with knowledge of the Memphis market Non-Profit Board Service: Serves on the boards of several non-profit organizations.
| |
| Executive Vice President, Marketing and Communications, FedEx Services, Inc. and FedEx Corp. | ||
| Independent director since 2016 | ||
| Age 52 | ||
Committees: Audit, Information Technology, Nominating & Corporate Governance, and the Bank’s Trust Audit Committee |
| R. Eugene Taylor | Mr. Taylor is the Vice Chairman of the Board of Directors of First Horizon and the Bank, a position he assumed upon the closing of First Horizon’s acquisition of Capital Bank Financial Corp. (“Capital Bank”) in 2017. He served as Chairman of the Board of Directors and Chief Executive Officer of Capital Bank from 2009 until 2017. Prior to 2009, Mr. Taylor spent 38 years at Bank of America Corporation, most recently as the Vice Chairman of the firm and President of Global Corporate & Investment Banking. Skills and Expertise: • Extensive experience in the banking and financial services industry • Experience in finance and accounting, employee matters, mergers and acquisitions, risk assessment, civic affairs, government relations, corporate governance, securities markets and compliance and similar matters associated with leadership positions at public companies • Knowledge of public company executive compensation and governance matters due to public company board service • North Carolina resident with knowledge of the North Carolina market Other Current Public Company Board Service: Sonic Automotive, Inc. (since 2015) Prior Public Company Board Service: Capital Bank Financial Corp. (2009-2017), Capital Bank Corp. (2011-2012), Green Bankshares, Inc. (2011-2012) and TIB Financial Corp. (2011-2012) | |
| Vice Chairman of the Board of First Horizon and the Bank | ||
| Director since 2017 | ||
| Age 70 | ||
Committees: Executive & Risk |
| 34 |
| VOTE ITEM NO. 1—ELECTION OF DIRECTORS |
| Luke Yancy III
| Mr. Yancy
Skills and Expertise:
• Experience in banking and financial services, including as commercial lending division head, group manager of business lending and consumer lending and senior credit officer
• Wide-ranging ties in the mid-south community
• Memphis resident
| |
| Retired President and Chief Executive Officer of the MMBC Continuum | ||
| Independent director since 2001 | ||
| Age 68 | ||
Committees: Audit and the Bank’s Trust (chair) and Trust Audit Committees |
The Board of Directors unanimously recommends that the shareholders votefor the election of all director nominees as described in Item No. 1.
| 35 |
| VOTE ITEM NO. 2—VOTE ON TECHNICAL AMENDMENTS TO MODERNIZE OUR RESTATED CHARTER |
Vote Item No. 2—Vote on Technical Amendments to Modernize Our Restated Charter
General Description of the Proposed Amendments
Our Board of Directors has approved, and recommends your approval of, several technical amendments to modernize our Restated Charter (“Charter”). Our Charter was originally adopted in 1968. Since then, Tennessee corporate law has been updated and corporate practices have changed significantly, but our Charter has not been amended to reflect those changes. We are proposing amendments that would replace Articles 5 and 11, delete Articles 7 and 8 and correct outdated cross-references in Articles 10 and 14. The amendments are described in greater
detail below. On January 23, 2018, the Board approved and authorized the proposed amendments and directed that the amendments be submitted to a vote of the holders of common stock at the Annual Meeting. If our shareholders approve this Vote Item 2, we expect to file a Certificate of Amendment with the Tennessee Secretary of State as soon as practicable following shareholder approval. Upon filing of the Certificate with the Tennessee Secretary of State, the proposed amendments will become effective.
Detailed Description of the Proposed Amendments
Amendments to Article 5
Article 5 of the Charter states the purposes and powers of the company. In the style of 50 years ago, it is two pages long with many details no longer listed in Tennessee law and no longer required to be listed in the charter. Therefore, we propose replacing current Article 5 with the following:
5. PURPOSES AND POWERS.
The Corporation is organized: to conduct one or more financial services businesses, including any and all related, ancillary, or supportive businesses; to own other companies or enterprises (or interests therein) which conduct financial services businesses, including any and all related, ancillary, or supportive businesses; to engage in any lawful act or activity for which corporations may be organized now or hereafter under the Tennessee Business Corporation Act or other statutes or law of Tennessee; and for every other lawful purpose or purposes. Except as provided otherwise in this Restated Charter, the Corporation has each and every power enumerated in or permitted now or hereafter by the statutes or law of Tennessee, and all powers ancillary thereto.
Article 5 of the Charter, as currently in effect, is included as part of Appendix B to this proxy statement.
Deletion of Articles 7 and 8
Article 7 deals with the commencement of business. It is factually unnecessary. Article 8 states that First Horizon shareholders do not have pre-emptive rights. Current Tennessee law provides that shareholders automatically have no pre-emptive rights unless the charter provides otherwise. It is unnecessary to repeat in our Charter what Tennessee law already provides, and removing Article 8 will not change our shareholders’ rights in any respect. Therefore, we are proposing to delete both Articles 7 and 8 in their entirety.
Articles 7 and 8 of the Charter, as currently in effect, are included as part of Appendix B to this proxy statement.
Amendment to Article 10
Article 10 of the Charter provides for serial preferred stock. The first paragraph contains a statutory cross-reference that is out of date and inconsistent in style with the other articles of the Charter. Therefore, we are proposing to update and modernize the cross-reference in the last sentence of the first paragraph as follows:
10. SERIAL PREFERRED STOCK.
[FIRST PARAGRAPH] * * * The Board of Directors shall have the authority to divide any or all such classes into series and, within the limitation of the statutes and law of Tennessee, particularly Section 48-16-102 of
| 36 |
| VOTE ITEM NO. 2—VOTE ON TECHNICAL AMENDMENTS TO MODERNIZE OUR RESTATED CHARTER |
the Tennessee Business Corporation Act or any successor provision thereto, fix and determine the relative rights and preferences of the shares of any series so established.
The relevant portion of Article 10 of the Charter, as currently in effect, is included as part of Appendix B to this proxy statement.
Amendment to Article 11
Article 11 of the Charter deals with the powers of the company. It contains substantial detail that is no longer required to be included in a corporate charter by Tennessee law. Only one power currently enumerated, that of the Board to remove any director for cause, must remain in the Charter if that power is to be preserved, and so it is included in the proposed replacement language. We are proposing to replace current Article 11 with the following:
| 11. | MANAGEMENT BY BOARD OF DIRECTORS. |
(a) All corporate powers shall be exercised by, and the business and affairs of the Corporation shall be managed under the direction of, the Board of Directors. The Board of Directors may exercise all powers conferred or permitted by the statutes or law of Tennessee.
(b) Without in any way limiting any of the objects or purposes or powers of the Board of Directors, whether primary or secondary, it is hereby expressly declared and provided that the Board of Directors shall have the power to
remove any director for cause, within the meaning of applicable statutes or law of Tennessee, by a vote of a majority of the entire Board of Directors.
Article 11 of the Charter, as currently in effect, is included as part of Appendix B to this proxy statement.
Amendment to Article 14
Article 14 of our Charter limits the personal liability of directors as permitted by a particular Tennessee statute, section 48-12-102(b)(3) of the Tennessee Business Corporation Act. The limitation has three exceptions, one of which is a cross-reference to another section. The referenced section number has changed from 48-18-304 to 48-18-302. Therefore, we propose to replace current Article 14 with the following:
14. DIRECTOR LIABILITY.
No director shall be personally liable to the Corporation or its shareholders for monetary damages for breach of fiduciary duty as director, except for liability (i) for any breach of the director’s duty of loyalty to the Corporation or its shareholders, (ii) for acts or omissions not in good faith or which involve intentional misconduct or a knowing violation of law, or (iii) under Section 48-18-302, or any successor provision thereto, of the Tennessee Business Corporation Act.
Article 14 of the Charter, as currently in effect, is included as part of Appendix B to this proxy statement.
The Board of Directors unanimously recommends that the shareholders votefor the approval of the proposed amendments to the Charter as described in Item No. 2.
| 37 |
| VOTE ITEM NO. 3—ADVISORY RESOLUTION TO APPROVE EXECUTIVE COMPENSATION |
Vote Item No. 3—Advisory Resolution to
Approve Executive Compensation
First Horizon’s executive compensation program received solid shareholder support last year and was approved, on an advisory basis, by 98.2%95.2% of the votes cast at the 20162017 annual meeting. In accordance with SEC rules, we are again seeking a vote from our shareholders to approve, on an advisory basis, the compensation of our named executive officers as disclosed in this proxy statement. Highlights of our corporate performance in
in 20162017 and the ways in which we link executive compensation to long-term performance are discussed below. The Compensation Discussion & Analysis beginning on page 4043 of this proxy statement provides a detailed discussion of 20162017 compensation for our executive officers and related matters. We encourage you to review closely both that section and the tabular disclosure that follows it.
20162017 Corporate Performance and Compensation Outcomes
Our strategic and operating results in 2017 were outstanding. We completed three acquisitions—of Capital Bank, Coastal Securities and Professional Mortgage Company, becoming the fourth largest regional bank in the Southeast with $41 billion in total assets and more than 800,000 customers. Compared with 2016, were excellent. Consolidatedconsolidated revenues grew 9%increased by 4%, while average loans and core deposits grew 10% and 11%, respectively, compared with 2015. Consolidated diluted earnings per share available to common shareholders (EPS) for 2016 were 94 cents per share, substantially better than 2015.net interest income was up 16%. In 20162017 we increased our per share common dividend rate by 17%29%, to 2836 cents per year, and we increased it again in early in 2017 we announced a 29% increase,2018 by 33% to 3648 cents per year. Total shareholder return (TSR) for 2016 was 40%, our fifth consecutive year of positive TSR.
Underlying our results were solid achievements in our core businesses of regional banking and fixed income. Regional bankincome in 2017. Fixed income average daily revenue was approximately $696 thousand. Compared with 2016, regional banking pre-tax income increased by 36%, and average loans in 2016and average deposits were up 15% (following a similar rise in 2015); net interest income grew 13%; and total revenues grew 9%. Commercial lending growth was especially strong, enhanced by our acquisition of franchise finance loan portfolios in the third quarter. Fixed income noninterest income was up 16% in 2016, in spite of adverse market conditions late in the year.11%, respectively. We continued to discipline our deployment of resources based on economic profit
(EP) principles and risk-adjusted return on capital analytics.
The Federal Funds rate was increased in December 2015 and again a year later. The first increase helped our net interest margin for 2016, and we expect the second increase will benefit our 2017 margin. Because we cannot control rate actions by the government, we continue to aggressively manage our net interest spreads and to strive for strong loan growth across our commercial and consumer banking businesses.
The Compensation Committee usedtook these actionsachievements and outcomesresults into account in executive compensation decisions, as examined in more detail in the Compensation Discussion & Analysis section of this proxy statement. Of particular note, pretax income was a major driver of 2016 bonus outcomes. See “Annual MIP Bonus” beginning on page 49 for additional information. In addition, although no decisions have been made, in fiscal 2017 the Committee expects to deliver value commensurate with the achievements of the past five years.
Alignment with Long-Term Performance
decisions. Our compensation policies and philosophiespractices are designed to align the interests of all of our employees, including our executives, with the interests of our shareholders. We seek to attract, retain, incent, and reward individuals who contribute to the long-term success of the company.
Key practices linking performance to compensation include:include significant weighting of pay mix in favor of awards at risk for financial or market performance, meaningful share retention requirements for executives, and correlation of the payouts of financial performance awards with total returns to our shareholders. Details regarding these practices and their effects are discussed throughout the Compensation Discussion & Analysis section of this proxy statement beginning on page 43.
“Say on Pay” Resolution
Under Section 14A of the Securities Exchange Act, our shareholders are entitled to an advisory vote on the compensation of our named executive officers as disclosed in this proxy statement pursuant to the compensation disclosure rules of the Securities and Exchange Commission, including the Compensation Discussion & Analysis, compensation tables and the related material. This advisory vote, commonly known as a “say on pay” proposal, gives our shareholders the opportunity to endorse or not endorse our executive pay program. At the 20112017 annual meeting, our shareholders had the opportunity to cast an advisory vote on how frequently we should hold a “say on pay” vote. The Board recommended and the shareholders approved an annual frequency for
the “say on pay” vote, and the Board subsequently determined that we would in fact conduct a “say on pay” vote at each annual meeting. At this meeting, shareholders will again have the opportunity to cast an advisory vote on how frequently we should hold a “say on pay” vote; see Vote Item No. 3 below in this proxy statement.
We believe that the information we have provided in the Compensation Discussion & Analysis, the executive compensation tables and the related disclosure contained in this proxy statement demonstrates that our executive compensation program was designed appropriately and is
working to ensure management’s interests are aligned with our shareholders’ interests to support the long-term success of First Horizon. Accordingly, the Board of Directors unanimously
| 38 |
| VOTE ITEM NO. 3—ADVISORY RESOLUTION TO APPROVE EXECUTIVE COMPENSATION |
recommends that you vote in favor of the following resolution:
“RESOLVED, that the holders of the common stock of First Horizon National Corporation (“Company”) approve, on an advisory basis, the compensation of the Company’s executive officers named in the Summary Compensation Table of the Company’s proxy statement for the 20172018 annual meeting of shareholders as such compensation is disclosed in such proxy statement pursuant to the compensation disclosure rules of the Securities and Exchange Commission, including the
Compensation Discussion & Analysis, the executive compensation tables and the related disclosure contained in the proxy statement.”
Because your vote is advisory, it will not be binding upon the Board, and the vote on this item will not be construed as overruling a Board decision or as creating or implying any additional fiduciary duty by the Board. However, the Compensation Committee will take into account the outcome of the vote when considering future executive compensation arrangements.
The Board of Directors unanimously recommends that the shareholders votefor Item No. 2.3.
| 39 |
| VOTE ITEM NO. 4—RATIFICATION OF APPOINTMENT OF AUDITORS |
Vote Item No. 3—Advisory Proposal on Frequency of Advisory Vote on Executive Compensation
Under the rules of the Securities and Exchange Commission, our shareholders will have the opportunity to cast an advisory vote on how frequently we should seek an advisory vote on the compensation of our named executive officers, as disclosed pursuant to the compensation disclosure rules of the Securities and Exchange Commission, such as Vote Item No. 2 above in this proxy statement. By voting on this Vote Item No. 3, shareholders will be able to indicate whether they would prefer an advisory vote on named executive officer compensation once every one, two, or three years. Regardless of the shareholder vote, the advisory vote on named executive officer compensation will occur not less frequently than once every three years in accordance with the rules of the Securities and Exchange Commission.
After careful consideration, our Board of Directors has determined that an advisory vote on executive compensation that occurs every year is the most appropriate alternative for First Horizon. Therefore, our Board of Directors recommends that you vote for a one-year interval for the advisory vote on executive compensation.
In formulating its recommendation, our Board of Directors considered that an annual advisory vote on executive compensation will allow our shareholders to provide us with their direct input on our compensation philosophy, policies and practices as disclosed in the proxy statement every year. Additionally, an annual advisory vote on executive compensation is consistent with our policy of seeking input from, and engaging in discussions with, our shareholders on corporate governance matters and our executive compensation philosophy, policies and practices. However, we understand that our shareholders
may have different views as to what is the best approach for First Horizon.
You may cast your vote on your preferred voting frequency by choosing the option of every year, every two years, every three years or abstain from voting when you vote in response to the resolution set forth below.
“RESOLVED, that a non-binding advisory vote of the holders of the common stock of First Horizon National Corporation to approve, on an advisory basis, the compensation of the named executive officers, as disclosed pursuant to the compensation disclosure rules of the Securities and Exchange Commission, including the Compensation Discussion and Analysis, the executive compensation tables and the related disclosure contained in the proxy statement, be held at an annual meeting of the shareholders, beginning with the 2017 annual meeting of shareholders, (1) every year, (2) every two years or (3) every three years.”
Our Board will review and consider the outcome of this vote when making determinations as to when the advisory vote on the compensation of our named executive officers will again be submitted to shareholders for approval at an annual meeting of shareholders. However, because this vote is advisory and not binding on the Board of Directors or First Horizon in any way, the Board may decide that it is in the best interests of our shareholders and First Horizon to hold an advisory vote on executive compensation more or less frequently than indicated by the outcome of this vote. The next vote on how frequently we should seek an advisory vote on executive compensation will take place at the company’s annual meeting of shareholders in 2023.
The Board of Directors unanimously recommends a vote on this Vote Item No. 3for the option of every year as the frequency with which shareholders are provided an advisory vote on executive compensation as disclosed pursuant to the compensation disclosure rules of the Securities and Exchange Commission.
Vote Item No. 4—Ratification of Appointment of Auditors
Appointment of Auditors for 20172018
KPMG LLP audited our annual consolidated financial statements for the year 2016.2017. The Audit Committee has appointed KPMG LLP to be our auditors for the year 2017.2018. Although not required by law, regulation or the rules of the New York Stock Exchange, the Board has determined, as a matter of good corporate governance and consistent with past practice, to submit to the shareholders as Vote Item No. 4 the ratification of KPMG LLP’s appointment as our auditors for the year 2017,2018, with the recommendation that the
shareholders vote for Item No. 4. Representatives of KPMG LLP are expected to be present at the annual meeting of shareholders with the opportunity to make a statement and to respond to appropriate questions. The 20162017 engagement letter with KPMG LLP was subject to alternative dispute resolution procedures. If the shareholders do not vote to ratify KPMG LLP’s appointment as our auditors for the year 2017,2018, the Board of Directors will consider what course of action would be appropriate.
Fees Billed to Us by Auditors during 20152016 and 20162017
The table below and the paragraphs following it provide information regarding the fees billed to us by KPMG LLP during 20152016 and 20162017 for services
rendered in the categories of audit fees, audit-related fees, tax fees and all other fees.
| 2015 | 2016 | 2016 | 2017 | |||||||||||
| Audit Fees | $ | 2,045,000 | $ | 1,991,000 | $ | 1,991,000 | $ | 2,871,230 | ||||||
| Audit-Related Fees | 276,500 | 268,500 | 268,500 | 287,898 | ||||||||||
| Tax Fees | 0 | 95,000 | 95,000 | 190,000 | ||||||||||
| All Other Fees | 0 | 0 | 0 | 0 | ||||||||||
| Total | $ | 2,321,500 | $ | 2,354,500 | $ | 2,354,500 | $ | 3,449,128 | ||||||
Audit Fees. Represents the aggregate fees billed to us by KPMG LLP for professional services rendered for the audit of our consolidated financial statements, including the audit of internal controls over financial reporting, and review of our quarterly financial statements or for services that are normally provided by KPMG LLP in connection with statutory and regulatory filings or engagements, including registration statements and offerings.offerings, and acquisition-related audit procedures.
Audit-Related Fees. Represents the aggregate fees billed to us by KPMG LLP for assurance and related services that are reasonably related to the performance of the audit or review of our consolidated financial statements and that are not reported under “Audit Fees” above. The amount for both years consists of fees for audits of subsidiaries, compliance attestation and other
procedures and reports on controls placed in operation and tests of operating effectiveness.
Tax Fees. Represents the aggregate fees, if any, billed to us by KPMG LLP for professional services for tax compliance, tax advice, and tax planning. The amountamounts for 2016 consistsand 2017 consist of fees for assistance with tax research and tax consulting services.
All Other Fees. Represents the aggregate fees (if any) billed to us by KPMG LLP for products and services other than those reported under the three preceding paragraphs.
None of the services provided to us by KPMG LLP and described in the paragraphs entitled “Audit-Related Fees,” “Tax Fees” and “All Other Fees” above were approved pursuant to the de minimis exception of SEC Rule 2-01(c)(7)(i)(C).
Policy on Pre-Approval of Audit & Non-Audit Services
The Audit Committee has adopted a policy providing for pre-approval of all audit and non-audit services to be performed by KPMG LLP, as the
registered public accounting firm that performs the audit of our consolidated financial statements that are filed with the SEC. Services either may be
| 40 |
| VOTE ITEM NO. 4—RATIFICATION OF APPOINTMENT OF AUDITORS |
approved in advance by the Audit Committee specifically on a case-by-case basis (“specific pre-approval”) or may be approved in advance (“advance pre-approval”). Advance pre-approval requires the Committee to identify in advance the specific types of services that may be provided and the fee limits applicable to such types of services, which limits may be expressed as a limit by type of service or by category of services. All requests to provide services that have been pre-approved in advance must be submitted to the Chief Accounting Officer prior to the provision of such services for a determination that the service to be provided is of the type and within the fee limit that has been pre-approved. Unless the type of service to be provided by KPMG LLP has received advance pre-approval under the policy and the fee for such service is within the limit pre-approved, the service will require specific pre-approval by the Committee.
The terms of and fee for the annual audit engagement must receive the specific pre-approval of the Committee. “Audit,” “Audit-related,” “Tax,” and “All Other” services, as those terms are defined in the policy, have the advance pre-
approval of the Committee, but only to the extent those services have been specified by the Committee and only in amounts that do not exceed the fee limits specified by the Committee. Such advance pre-approval shall be for a term of 12 months following the date of pre-approval unless the Committee specifically provides for a different term. Unless the Committee specifically determines otherwise, the aggregate amount of the fees pre-approved for All Other services for the fiscal year must not exceed seventy-five percent (75%) of the aggregate amount of the fees pre-approved for the fiscal year for Audit services, Audit-related services, and those types of Tax services that represent tax compliance or tax return preparation.
The policy delegates the authority to pre-approve services to be provided by KPMG LLP, other than the annual audit engagement and any changes thereto, to the chair of the Committee. The chair may not, however, make a determination that causes the 75% limit described above to be exceeded. Any service pre-approved by the chair will be reported to the Committee at its next regularly scheduled meeting.
The Board of Directors unanimously recommends that the shareholders votefor Item No. 4.
| 41 |
| OTHER MATTERS |
The Board of Directors, at the time of the preparation and printing of this proxy statement, knew of no other business to be brought before the meeting other than the matters described in this proxy statement. If any other business properly comes before the meeting, the persons named in the enclosed proxy will have discretionary authority to vote all proxies in accordance with their best judgment.
Shareholder Proposal & Nomination Deadlines
If you intend to present a shareholder proposal at the 20182019 annual meeting, it must be received by the Corporate Secretary, First Horizon National Corporation, P.O. Box 84, Memphis, Tennessee, 38101, not later than November 13, 2017,12, 2018, for inclusion in the proxy statement and form of proxy relating to that meeting. In addition, Sections 2.8 and 3.6 of our Bylaws provide that a shareholder
who wishes to nominate a person for election to the Board or submit a proposal at a shareholders’ meeting must comply with certain procedures whether or not the matter is included in our proxy statement. These procedures require written notification to us, generally not less than 90 nor more than 120 days prior to the date of the shareholders’ meeting. If, however, we give fewer
than 100 days’ notice or public disclosure of the shareholders’ meeting date to shareholders, then we must receive the shareholder notification not later than 10 days after the earlier of the date notice of the shareholders’ meeting was mailed or publicly disclosed. Shareholder proposals and
nominations for election to the Board must be submitted to the Corporate Secretary. The shareholder must disclose certain information about the nominee or item proposed, the shareholder and any other shareholders known to support the nominee or proposal. Section 2.4 of our Bylaws provides that our annual meeting of shareholders will be held each year on the date and at the time
fixed by the Board of Directors. The Board of Directors has determined that our 20182019 annual meeting will be held on April 24, 2018.23, 2019. Thus, shareholder proposals submitted outside the process that permits them to be included in our proxy statement and director nominations must be submitted to the Corporate Secretary between December 25, 201724, 2018 and January 24, 2018,23, 2019, or the proposals will be considered untimely. Untimely proposals may be excluded by the Chairman or our proxies may exercise their discretion and vote on these matters in a manner they determine to be appropriate.
| 42 |
| COMPENSATION DISCUSSION AND ANALYSIS |
Compensation Discussionand Analysis
This CD&A section of our proxy statement discusses and analyzes the compensation programs applicable to our senior executives. In particular, this section focuses on five of those executives, referred to as the “Named Executive Officers” or “NEOs”:
| Named Executive Officer | Position | |
| D. Bryan Jordan | Chairman of the Board, President, and Chief Executive Officer | |
| William C. Losch III | Executive Vice President – Chief Financial Officer | |
| Michael E. Kisber | President – FTN Financial | |
| David T. Popwell | President – Banking | |
| Charles T. Tuggle, Jr. | Executive Vice President – General Counsel |
The Compensation Committee of the Board oversees compensation for all NEOs. For more information see “The Compensation Committee” beginning on page 18 of this proxy statement.
2016 Corporate Performance2017 Financial & Strategic Overview
Our model for long-term financial performance targets is referred to as the “bonefish.” We hope to achieve bonefish targets using organic expansion and improvement coupled with strategic and operating resultsacquisitions. Our “head” goal in 2016 were excellent. Consolidated revenues grew 9%, while2017 was return on tangible common equity (ROTCE) of at least 15%. Key measures which support the bonefish head included: Return on assets (ROA); Efficiency ratio (Efficiency); Ratio of net charge-offs to average loans (NCO Ratio); and core deposits grew 10% and 11%, respectively, compared with 2015. Consolidated diluted earningsNet interest margin (NIM).
Results for 2017 in those measures are presented below. Non-bonefish measures (earnings per share available to common shareholders (EPS) for 2016 were 94 cents per share, substantially better than 2015. In 2016, we increased our common dividend rate by 17%, to 28 cents per year. Early in 2017, we announced a 29% increase, to 36 cents per year. Total shareholder return (TSR) for 2016 was 40%, our fifth consecutive year of positive TSR.
Underlying our results were solid achievements in our core businesses of regional banking and fixed income. Regional bank average loans in 2016 were up 15% (following a similar rise in 2015); net interest income grew 13%; and total revenues grew 9%. Commercial lending growth was especially strong, enhanced by our acquisition of franchise finance loan portfolios in the third quarter. Fixed income noninterest income was up 16% in 2016, in spite of adverse market conditions late in the year. We continued to discipline our
deployment of resources based on economic profit (EP) principles and risk-adjusted return on capital analytics.
equity (ROE), and loan growth) also are presented, for context. ROTCE and adjusted results are not in accord with generally accepted accounting principles (GAAP). The Federal Funds rate was increased in December 2015impacts of tax reform legislation and again a year later. The first increase helped our net interest margin for 2016, and we expect the second increase will benefit our 2017 margin. Because we cannot control rate actions by the government, we continue to aggressively manage our net interest spreads and to strive for strong loan growth across our commercial and consumer banking businesses.
The Compensation Committee used these actions and outcomes in compensation decisions, as examined in more detail later in this CD&A section. Of particular note, pre-tax income was a major driver of 2016 bonus outcomes. See “Annual MIP Bonus” beginning on page 49 for additional information. In addition, although no decisionscertain other notable items have been made,excluded from all adjusted results. Non-GAAP items are reconciled to GAAP items in fiscal 2017 the Committee expects to deliver value commensurate with the achievements of the past five years.Appendix C.
2017 Financial Highlights
| EPS / Adj EPS $0.65 / $1.11 | ROA / Adj ROA 0.59% / 0.96% 2017 Bonefish: 1.10% - 1.30% | ROE / Adj ROE 6.2% / 10.7% | ROTCE / Adj ROTCE 7.2% / 12.3% 2017 Bonefish: 15%+ | |||
| Efficiency / Adj Eff. 77% / 69% 2017 Bonefish: 60% - 65% | NCO Ratio 0.06% 2017 Bonefish: 0.20% - 0.60% | NIM 3.12% 2017 Bonefish: 3.25% - 3.50% | Avg. Loan Growth 10% |
Strategic Acquisitions Closed in 2017
| Capital bank | Coastal Securities | Professional Mortgage Company | ||
| $10 billion banking organization with over 150 branches in four Southeastern U.S. states | National leader in the trading, securitization, and analysis of Small Business Administration loans | Leading provider of institutional debt capital and commercial mortgage loan servicing |
| 43 |
| COMPENSATION DISCUSSION AND ANALYSIS |
Snapshot of First Horizon at Year-End 2017

2017 Industry Operating Environment
TheDuring 2017 the environment for the financial services industry in the United States has been relatively stable for the past several years.was mixed, with very low rates, coupled with slow but improving growth, driving key outcomes.
First Horizon Transformation Since 2007
Before 2008 we embarked on a national expansion of our mortgage platform and had begun to open bank branches in selected mortgage markets. The mortgage business had been profitable, but created substantial losses starting in 2007, when that business experienced substantial disruptions world-wide and a serious recession followed. That year our CEO departed and, later in 2007, Bryan Jordan was hired as Chief Financial Officer.
In 2008 we sold our mortgage businesses and Mr. Jordan was named CEO. Even with the businesses sold, however, we retained exposure for certain potential liabilities related to the businesses when we owned them. As the recession continued, losses from credit defaults
and mortgage repurchases grew. By 2009 legacy mortgage losses had become substantial.
During 2009 Mr. Jordan, with many senior roles filled with new hires and newly-promoted persons, began to develop management tools around the concepts of economic profit (profit after deducting the cost of invested capital) and risk-adjusted return on invested capital. Although managing legacy losses was a substantial task, management’s focus shifted to what we could control. These efforts led to the formulation of long-term primary and secondary financial goals which eventually became depicted in our “bonefish” diagram of long-term goals. The bonefish did not include goals for overall net income or shareholder
| 44 |
returns, but instead focused on return on equity (which has since been replaced with return on tangible common equity). The “head” measure aligns with economic profit principles and discipline, which ultimately drive bottom line results and shareholder returns.
As a result of these efforts, we divested a number of businesses and assets which did not “pull their weight” in terms of capital invested or risks taken. We invested resources with discipline, driven by expected economic profit or strong support of economically profitable endeavors. We cut expenses when it made economic sense. We
ingrained this discipline throughout the organization, creating and refining management tools to capture data, from the bottom up, on which to base decisions and measure outcomes.
As a result, our Board recognizes that our company has been transformed during Mr. Jordan’s tenure. A decade ago we were forced to abandon our national expansion strategy and, as substantial losses mounted, our quarterly cash dividend was eliminated. Today our business is sound and growing. Although this transformation involved a long process with many steps, key events are highlighted below.
First Horizon Turn-Around
Timeline of Key Events
| Year | Events | Net Income Avail. to Common ($ in millions) | Year-end stock price* | Annual Common Div. Rate* | ||||||||||||
| 2008 | 2Q: | $690M common stock sale augments capital, increases common shares by >50% | ||||||||||||||
| 3Q: | Sale of national mortgage businesses, promotion of Bryan Jordan to CEO | $ | (199 | ) | $ | 9.24 | Declined from $0.67 to 0 | |||||||||
| 4Q: | Enter TARP program | |||||||||||||||
| 2009 | FY: | Loan losses climb due to the recession and collapse of real estate values. | $ | (329 | ) | $ | 12.60 | 0 | ||||||||
| 2010 | 2Q: | First public presentation of the Bonefish long-term goals in earnings slides. “Head” goal was ROE >15%; actual ROE in 2010 was a loss. | ||||||||||||||
| 4Q: | Repay TARP funds, exit program | $ | (58 | ) | $ | 11.78 | 0 | |||||||||
| FY: | $190M repurchase loss accruals regarding legacy mortgage lending, primarily with GSEs | |||||||||||||||
| 2011 | FY: | $160M repurchase loss accruals regarding legacy mortgage lending, primarily with GSEs | $ | 131 | $ | 8.00 | $ | 0.04 | ||||||||
| 2012 | FY: | $299M repurchase loss accruals regarding legacy mortgage lending, primarily with GSEs | $ | (27 | ) | $ | 9.91 | $ | 0.04 | |||||||
| 2013 | FY: | $170M repurchase loss accruals regarding legacy mortgage lending, including GSE settlements | $ | 21 | $ | 11.65 | $ | 0.20 | ||||||||
| 2014 | 2Q: | 150thanniversary of First Tennessee Bank founding | $ | 216 | $ | 13.58 | $ | 0.20 | ||||||||
| 2015 | 1Q: | $162M settlement with DOJ & HUD regarding legacy FHA mortgage lending | $ | 80 | $ | 14.52 | $ | 0.24 | ||||||||
| 4Q: | $0.4B TrustAtlantic Bank merger closed | |||||||||||||||
| 2016 | $ | 221 | $ | 20.01 | $ | 0.28 | ||||||||||
| 2017 | ||||||||||||||||
| 4Q: | $10B Capital Bank merger closed | |||||||||||||||
| $ | 159 | $ | 19.99 | $ | 0.36 | |||||||||||
| 4Q: | Tax reform triggers $82M of adverse tax adjustments | |||||||||||||||
| 2018 | 2Q: | Expect to complete Capital Bank integration | na | na | $ | 0.48 | ||||||||||
* 2008-10 prices and dividends have been adjusted to reflect stock dividends distributed from October 2008 to January 2011.
| COMPENSATION DISCUSSION AND ANALYSIS |
Alignment of Pay with Performance
Policies and Practices
Our compensation policies and philosophiespractices are designed to align the interests of our employees with the interests of our shareholders. We seek to attract, retain, incent, and reward individuals who contribute to our long-term success.
Key practices linking performance to compensation include:
| • |
| • |
| • | The Committee strives to achieve correlation of payout with TSR, especially over longer time horizons. Payouts of our financial-performance awards over the past several years have |
Details regarding thesecorrelated well with total returns to our shareholders over the time periods covered by those awards. TSR did not directly drive payout; instead, this pattern shows that our financial performance metrics are well-linked to the interests of our shareholders.
2017 Actions
Key actions taken for 2017 implementing our pay-for-performance policies and practices are discussed throughout this CD&A section.were:
| • | Bonus Metrics. Early in 2017 the Committee established quantitative income and efficiency grids, directly tied to budget. |
| • | PSU Metrics. Early in 2017 the Committee granted PSUs which will rank our return-on-equity performance against a broad set of peer banks. |
| • | Regular Annual Pay Mix. For 2017, the structure and mix of regular annual pay components for executives remained strongly weighted in favor of at-risk features related to financial performance or our stock’s market value. As discussed below, Mr. Jordan had 80% of his regular 2017 target package at-risk. |
Mr. Jordan was recruited as CFO in 2007 and promoted to CEO in September 2008, to rebuild our company. Previous management embarked2008. As discussed above in “First Horizon Transformation Since 2007” beginning on a strategy to build national mortgage originationpage 44, during and servicing businesses, along with related real estate lending. These legacy businesses were significantly impacted bysince the financial crisis; they have resulted in large expenses for us in many years since 2007, most recently in 2015.
crisis Mr. Jordan has led the restructuring of theour company, the development and implementation of new strategies, and the recruitment of the current management team. He has emphasized improving economic profit (EP) and controlling cost. Our operating
results have improved significantly.significantly during his tenure. The Compensation Committee considered his significant contributions in turning around the company when making decisions about his pay for 2016.2017. In each of the past three years, Mr. Jordan has met or exceeded his personal goals. He has providedprovides consistent, critical leadership in challengingthese dynamic times.
The Committee believes that Mr. Jordan’s leadership is known throughout the industry. He is a director or executive committee member of the Federal Reserve Bank of St. Louis, American Bankers Association, Mid-Size Bank Coalition of
America, Tennessee Bankers Association, and Operation HOPE (which strives to provide banking services to financially or socially disadvantaged persons). In 2016 he was named CEO of the year byInside Memphis Business, and was featured as a top-ten CEO inAmerican Banker. These associations and recognitions reflect well on our company and enhance Mr. Jordan’s connections to the financial services community.
Mr. Jordan’s target-level pay is in line with the median of FHN’s peer group. His pay mix—mix, the structure of the various components, of his pay—is also consistent with that of company peers. Final amounts paid vary from
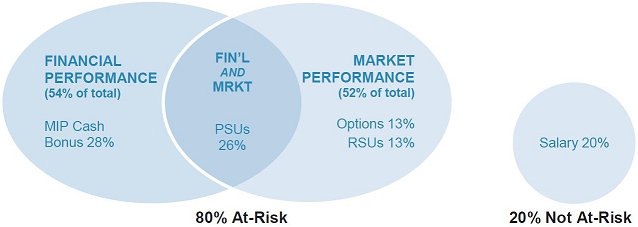
The Committee has weighted the pay mix of our NEOs heavily in favor of incentives tied to thefinancial performance of our company’s operations and themarket performanceof our common stock. As illustrated in the following diagram, fully 80% of Mr. Jordan’s regular pay package, measured at target, based on achievementis at-risk in one or both of performance goals and changes in our stock price.those areas:
| 46 |
| COMPENSATION DISCUSSION AND ANALYSIS |
CEO Pay At Risk for Performance
Performance and pay mix have both short-term and long-term components. The relationship of these components to each other, and to our total shareholder return (TSR), is illustrated in the four charts that follow. TSR consists of stock price performance plus reinvested dividends.
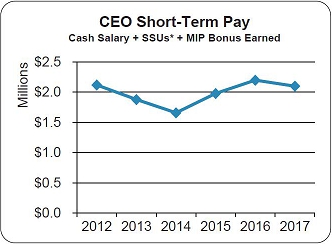
The followingfirst two charts show total regular short-term compensation paid to the CEO in recent years and year-end TSR over the same period, respectively.period. For this purpose, short-term pay is limited to cash salary, salary
stock units (SSUs) measured at
grant (2011-13)(2012-13 only), and total earned annual bonus measured when earned.bonus. Those components have short time horizons, and they are especially sensitive to the annual changes in financial performance and environmental circumstances whichthat tend to impact TSR in the short term.
 | 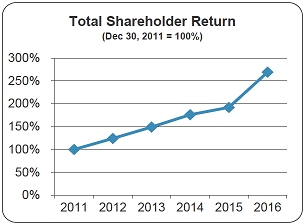 | |
The two charts above show that over the five-year period our TSR has risen consistently whiletrend in regular short-term CEO pay in the past three years, after SSUs were discontinued, has been up and down. TSR foraligned with the year 2016 was positive 40%. Setting the base year at 100%, TSR for the entire five-year period was 269%.
From 2011 through 2013, we used the SSU program as a retention incentive, reducing other pay components compared to current levels. After 2013, bonus opportunity increased as the SSU program ended.trend in our TSR.
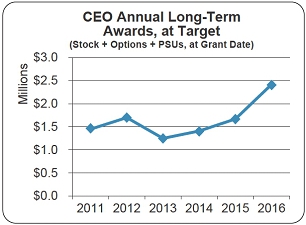
To provide context, the following two charts show regular annual long-term and performance-based awards granted to the CEO over the same period. Values shown are those considered by the Committee at grant, rather than those assigned by accounting guidance. The charts show that long-term and performance award levels recently have trended upward, though less consistently and at a slower pace than our TSR has risen.
| * | In 2012 and 2013 we used a SSU program as a retention incentive, reducing other pay components compared to current levels. Bonus opportunity increased when the program ended. | ||
 |  | ||

Despite environmental headwinds and market volatility, an investment in our common stock at the end of 2012 more than doubled in value by the end of 2017. TSR partly is driven by our dividend rate, which grew over this period, but mainly is driven by our stock price. Stock prices are largely a reflection of investor expectations for the company’s future.
Our earnings during many of the years shown have been impacted significantly, and somewhat unpredictably, by “non-strategic” obligations associated with mortgage businesses pursued by prior management.legacy mortgage-related businesses. Earnings in our regional banking business generally have improved
during this period even though lending margins have been squeezed by the low rate environment and fee
| 47 |
| COMPENSATION DISCUSSION AND ANALYSIS |
revenues have been curtailedreduced by regulatory and market pressures. Earnings in our fixed income business fellhave been reduced during much of this period mainly due to the rate environment, with some volatility. Although our stock price has been volatile during this period, impacting TSR in the short term, over these years our stock price has been less severely impacted by the factors mentioned above than our earnings have been.
The next two charts compare actual payouts of bonus and regular performance stock unit (PSU) awards and our TSR during the award timeframes. The first chart shows the percentage of annual MIP target bonus paid to our CEO in each of the years 2012 to 2017 alongside the TSR we achieved during the calendar year covered by the
bonus. The second chart shows the percentage of target earned for those regular PSUs that vested during 2012-2017 alongside the TSR we achieved during each PSU’s lifetime. A regular PSU’s lifetime runs from grant to initial vesting, roughly three years for each award. In each case the TSR base level is set at 100%; a positive return is added to 100%, and a negative return is subtracted from that level.
The charts show that the percentage earned is aligned with the TSR achieved during the same period. Specifically, bonuses have tended to be above 100% of target only when single-year TSR has been quite strong, and regular PSU payout percentages have tended to fall and rise in step with the TSR achieved during each PSU’s lifetime.
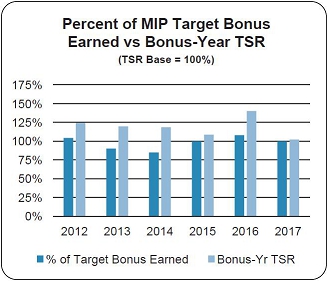
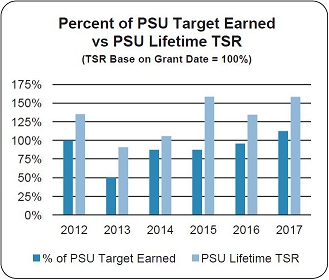
TSR has not been used as a performance goal in our regular annual MIP bonus and PSU awards (though it has been used in a few special long-term awards). The alignment of regular MIP bonus and PSU outcomes with TSR over corresponding
time periods illustrates that the performance goals set by the Committee, and the Committee’s exercise of discretion in administering those programs, have, over time, aligned well with significant growth of shareholder value.
| 48 |
period mainly due to the rate environment, though 2015 and 2016 showed significant improvement over earlier years.
| COMPENSATION DISCUSSION AND ANALYSIS |
Despite the headwinds and volatility overall, since 2011 our TSR has grown consistently and vigorously, nearly tripling the value of an investment in our stock over the five years shown. TSR is partly driven by dividends paid, which increased over this period, but is mainly driven by
our stock price, which is largely a reflection of investor expectations for the company’s future. In 2016, our stock price experienced significant volatility but closed much higher for the year.
Mr. Jordan’s accomplishments at FHN have been recognized outside our company. For 2016, he was recognized byAmerican Banker as one of America’s top ten bank CEOs.
Alignment with Governance Principles
Our executive compensation practices embrace many best practice corporate governance principles.
| Practices We Employ Include | Practices We Avoid or Prohibit Include | |||
  | Performance-based (at-risk) and stock-based payemphasized |  |  | Tax gross-up features* |
| Performance measures drive shareholder value | | | Stock option repricings |
| Performance measures emphasize controllableoutcomes | | | Discount-priced stock options |
| Committee use of independent compensationconsultant | | | Single-trigger change in control payouts |
| Meaningful share ownership requirements | | | Employment agreements |
| Require holding 50% of after-tax vested stockawards during career with the company, rising | | | Hedging transactions in First Horizon stock(e.g.,trading derivatives, taking short positions, |
| Double-trigger on change in control features andagreements (CIC event plus | | | Personal use of corporate |
| Clawbacks if financial results relevant to cash orstock performance awards are restated | |||
| * | An excise tax gross-up feature is grandfathered in certain older change-in-control severance agreements, but has not been used in new agreements since 2008. | |
| ** | The CEO’s spouse is permitted to accompany the CEO on business flights. |
Overview of Direct Compensation Components
Unchanged from 2015,2016, the major components of executive compensation in 20162017 consisted of cash salary, annual bonus under our Management Incentive Plan (MIP), and annual stock awards granted under our Equity Compensation Plan (ECP). Executive stock awards in 20162017 consisted of performance stock units (PSUs), stock options, and restricted stock units (RSUs).
The key corporate performance measure for 20162017 cash bonuses was adjustedbased on consolidated pre-tax earnings (consolidated).earnings. The key performance measure for 20162017 PSUs was adjustedbased on return on equity (ROE) for our core segments measured in relation to certain peer banks over three years.
The following presents an overview of the direct compensation components for our NEOs.
| 49 |
| COMPENSATION DISCUSSION AND ANALYSIS |
Regular Direct Compensation Components in 2016
2017
| Component | Primary Purpose | Key Features | ||
| Cash salary | Provide competitive baseline compensation to attract and retain executive talent. | Salaries are determined based on prevailing market levels with adjustments for individual factors such as performance, experience, skills, and tenure. | ||
| Annual cash bonus under MIP | Create a financial incentive for achieving or exceeding one-year company and/or | For the | ||
| Annual stock awards: PSUs, stock options, and RSUs | Provide performance and service-vested equity-based long-term incentives |
Compensation Practices & Philosophies
Our compensation programs are designed to attract and retain a talented workforce. We recruit from a broad talent pool. Our people in turn may be recruited by competitors, other financial services firms, and firms in other industries. The
The
total compensation opportunity we provide at each level is designed to be competitive so that over the long term we reduce the risk of losing our best people.
The Compensation Committee reviews the compensation practices of a peer group of selected U.S. banks of roughly comparable size (“Peer Banks”)and business mix (Peer Banks). These are banks with whom we most typically compete for talent, and theThe peer review helps our programs remain competitive. For many years the Committee has considered specific data from
Peer Banks in setting the compensation components for our executives. The Peer Banks used in 20162017 were fourteen regional financial services companies selected by the Committee, listed
shown in the diagram below. The Peer Bank group is adjusted periodically in response to changes in our company or the industry, but was unchanged for 2017.
Late in 2016.2017 we acquired Capital Bank, which increased our asset size by roughly one-third. Overall, we have increased our asset size by more than 60% since 2012, and our business mix has shifted toward traditional banking services. For 2018 the Committee fully reconsidered our Peer
| 50 |
| COMPENSATION DISCUSSION AND ANALYSIS |
Bank list, re-evaluating our current size, business mix, and target markets. As a result, for 2018 we removed three banks and added two, for thirteen
Peer Banks total. The change in Peer Banks used in 2017 versus 2018 is illustrated in this diagram:
Changes to Peer Bank List from 2017 to 2018
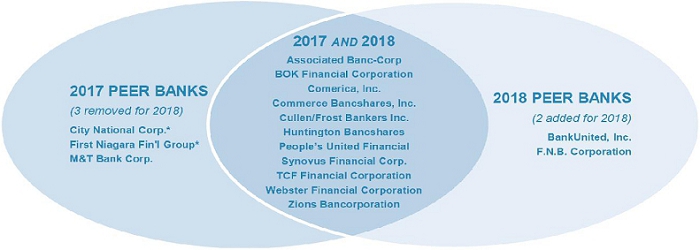
| * | City National and First Niagara have been acquired. Pre-acquisition compensation data was included in the |
The Committee uses peer and other market data to help establish the size and terms of the components of direct compensation for executives. Salary is targeted at the median of the market for each position. Actual salaries may be higher or lower than median based on individual factors—performance, experience, skills, and tenure—or retention needs. Bonus opportunities and equity awards are targeted similarly: target-level compensation is intended to be paid for median performance, and maximum compensation is intended to be paid for top-quartile performance.
For special compensation components, including retention awards and individual retirement and severance arrangements, relevant market data often is not available. In those cases the Committee relies on recommendations from management (for awards other than to the CEO)
along with external advice from the Committee’s independent consultant to determine the types,
amounts, or terms of such benefits that are reasonable and appropriate for the circumstances.
The Total Shareholder Return Performance Graph (“TSR graph”) that appears in our annual report to shareholders (on page 182186 of that report) uses the published Keefe, Bruyette & Woods regional banking index (ticker symbol KRX) against which to compare our total shareholder return, which consists of stock price performance plus reinvested dividends.TSR. The KRX index encompasses fifty regional U.S. banks, including us. The annual PSU awards granted to executives in 20162017 used the KRX index banks as the group against which our core-segment ROE will be ranked over the three-year performance period of those awards. The Committee believes that, in the context of a multi-year financial performance award, the KRX index provides a larger, and more stable, group representing “the industry” against which to measure our performance, even though many of those banks would not be appropriate for benchmarking compensation practices.
Impact of Shareholder Vote on Compensation
The Compensation Committee made nearly all key decisions regarding 20162017 compensation for the named executivesNEOs early in the year. At that time the Committee was aware ofknew the outcome of the vote for the shareholder advisory resolution on executive compensation at the 20152016 annual meeting. At the 2015 meeting,meeting: “For” received 94.1%98.2% of the shares voted, similar to the results in 20142015 and 2013.2014. The 20152016 outcome was part of the
mix of factors considered by the Committee early in 2016.2017, and had no direct or
separately identifiable effect on Committee decisions. Although not considered by the Committee in relation to 20162017 awards, at the 20162017 annual meeting “For” received 98.2%95.2% of the shares voted. We view these levels of shareholder support for our executive compensation program as indicative of broad shareholder agreement with the philosophy and policies on which our executive compensation program is premised.
| 51 |
| COMPENSATION DISCUSSION AND ANALYSIS |
Under our stock ownership guidelines all NEOs and directors are required to retain 50% of the net after-tax shares received from stock awards. The retention level increases to 75% unless certain minimum stock ownership levels are met. The retention requirement applies during the rest of their careers with us, except that executives who reach age 55 are permitted to sell shares held at least three years to diversify ahead of retirement. Supportive of the guidelines, a separate policy prohibits the hedging of positions in our stock.
The CEO’s minimum ownership level under the guidelines is six times cash salary. The levels for the other named executives are two or three times their respective cash salaries, depending upon position. Director levels generally are five times
cash base
retainer. retainer, and the Vice Chairman’s level is six times cash salary. For this purpose, fully-owned shares, restricted stock, RSUs paid in shares, and shares held in tax-deferred plans are counted, while PSUs, stock options, and RSUs paid in cash are not counted.
We intend for the combined emphasis on corporate performance in setting executive compensation and meaningful stock retention to strongly link the interests of our executives with those of our shareholders.
Guideline ownership levels are assessed annually in the third quarter. In the 20162017 assessment, all NEOs exceeded guideline ownership levels and all complied with the retention requirement.
Performance compensation under the MIP, ECP, or otherwise whichthat is paid based on erroneous financial data is recoverable under our Compensation Recovery Policy if the recipient caused the error or is responsible for the data’s
accuracy. Additional clawback provisions apply to
most types of stock awards ifif: certain misconduct occurs, such as fraud or solicitation.
Starting in 2014, clawback provisions in our stock awards were expanded to include the following
events:solicitation; grant or payment of an award is based on erroneous financial data and terminationdata; or employment is terminated for cause.
The look-back period for recovery generally is two years after vesting.
Use of Compensation Consultants
The Committee continued its engagement of an independent consulting firm, Frederic W. Cook & Co., Inc. (“FW Cook”), to provide analysis and advice on all executive compensation-related matters (including assessment of peer groups, competitive market data, pay mix, and compensation design). Among other things, FW Cook assists the Committee in its reviews of compensation program actions recommended by management. FW Cook has no other relationships with the company or management. Key engagement items for FW Cook in 20162017 were:
In 20162017 management engaged an external compensation consultant, McLagan, mainly to conduct an updated competitive pay assessment for executives and for peer metrics.
Additional information concerning our use of compensation consultants appears under the caption “The Compensation Committee—Use of Consultants” on page 19pages 19-20 of this proxy statement.
Role of Management in Compensation Decisions
Management administers our compensation plans, monitors compensation programs used by other companies, and considers whether new or amended compensation programs are needed to maintain the competitiveness of our executive compensation packages. Management presents recommendations to the Committee for approval. The CEO ultimately oversees the development of
recommendations. If executive-level exceptions are appropriate, such as approval of an executive’s early retirement, management generally reviews the facts of the situation and provides a recommendation to the CEO and, ultimately, to the Committee for approval. The CEO does not participate in Committee deliberations concerning his own compensation.
| 52 |
| COMPENSATION DISCUSSION AND ANALYSIS |
SectionIn 2017 and earlier years, section 162(m) of the U.S. Internal Revenue Code generally disallowsdisallowed a tax deduction to public companies for compensation exceeding $1 million paid during the year to the CEO and the three other highest-paid executive officers at year-end (excluding the Chief Financial Officer). Certain performance-based compensation iswas not, however, subject to the deduction limit. The Committee considered these tax implications in making compensation decisions for 2016.2017.
Although deductibility iswas an important consideration, competitive and other factors maycould outweigh it. As a result, although a substantial majority of NEO compensation iswas designed to be deductible
“performance-based” each year, typically a portion iswas not. That portion can varyvaried from year to year, especiallyyear.
Late in 2017 Congress repealed the performance-based exception, applicable in 2018. As a result, section 162(m) is likely to play no significant role in structuring future executive compensation awards. The application of transition provisions to awards outstanding when repeal occurred is uncertain in some respects, but in many cases may require adherence to significant restrictions if non-performance retentiondeductibility is to be preserved. When dealing with various outstanding awards are made atin the NEO level.future, the Committee intends to consider preservation of deductibilty as one factor, among many, in making decisions consistent with the objectives of the program in question and our business needs.
Direct Compensation Components for NEOs
The direct components of NEO compensation in 20162017 were cash salary, annual bonus under the MIP, and annual stock awards consisting of RSUs, stock options, and PSUs under our shareholder-
approved Equity Compensation Plan. An overview of these components appears under “Overview of Direct Compensation Components” beginning on page 4349 of this proxy statement above.
In setting the size of the direct compensation components for 2016,2017, the Compensation Committee considered the total compensation opportunity at target payout levels for each position. The target total mix of the direct components is summarized in the following chart, which illustrates the regular annual pay packages
planned by the Committee early in the year. Special promotion or retention awards are not included in the chart. See “Summary Compensation Table” beginning on page 5867 for additional information concerning amounts paid or earned in 2016.2017.
20162017 Direct Compensation Mix at Target
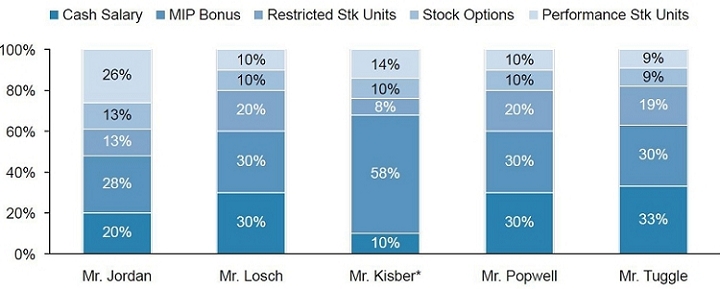
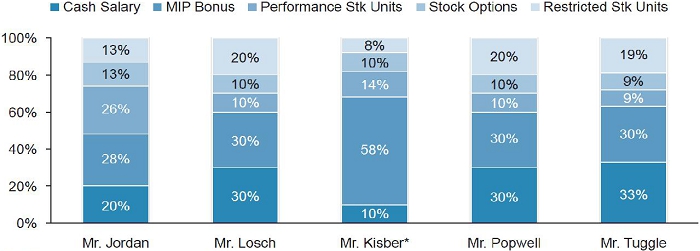
| * | Mr. Kisber’s compensation package differs from the other NEOs’ and is structured to be competitive within the fixed income industry. The chart shows hispotential mix for 2017. His annual bonus opportunity has approximately double the weighting of other NEOs, and the other components are relatively compressed. Also, unlike other NEOs, stock awards |
| 53 |
| COMPENSATION DISCUSSION AND ANALYSIS |
| actually granted to him in a given year depend significantly upon performance of our fixed income business the previous year. |
The amount of each component usually is determined in relation to cash salary. Salary levels are based largely on these factors: individual experience, individual performance, level of responsibility, and competitive market levels. A
specific need for retention also can play a role. No specific weighting is given to any one factor. The size of each direct component for the named executives as a percentage of cash salary is shown in the chart below.
Sizing of 20162017 Direct Compensation Components
As a Percentage of Annual Cash Salary
| 2016 Annual Stock Awards | ||||||||||||||||||||
| Annual | Performance | |||||||||||||||||||
| Bonus | Restricted | Stock Units | Total Stock | |||||||||||||||||
| NEO | (target) | Stock Units | Stock Options | (target) | Awards | |||||||||||||||
| Mr. Jordan | 140 | % | 63 | % | 63 | % | 125 | % | 250 | % | ||||||||||
| Mr. Losch | 100 | % | 70 | % | 35 | % | 35 | % | 140 | % | ||||||||||
| Mr. Kisber* | 583 | % | 83 | % | 93 | % | 140 | % | 317 | % | ||||||||||
| Mr. Popwell | 100 | % | 70 | % | 35 | % | 35 | % | 140 | % | ||||||||||
| Mr. Tuggle | 90 | % | 55 | % | 28 | % | 28 | % | 110 | % | ||||||||||
| 2017 Annual Stock Awards | ||||||||||
| Annual | Performance | |||||||||
| NEO | Bonus (target) | Restricted Stock Units | Stock Options | Stock Units (target) | Total Stock Awards | |||||
| Mr. Jordan | 140% | 63% | 63% | 125% | 250% | |||||
| Mr. Losch | 100% | 70% | 35% | 35% | 140% | |||||
| Mr. Kisber* | 583% | 83% | 93% | 140% | 317% | |||||
| Mr. Popwell | 100% | 70% | 35% | 35% | 140% | |||||
| Mr. Tuggle | 90% | 55% | 28% | 28% | 110% | |||||
| * | Mr. Kisber’s compensation package differs from the other NEOs’ to provide a compensation opportunity |
Key factors considered when target levels were set are the appropriate mix of base pay (salary) versus pay at risk for corporate performance or stock value performance, and the mix between short- and long-term compensation. The chart and table above show that the CEO’s regular compensation package is more heavily weighted in favor of performance-based payfinancial performance, and more heavily at-risk overall, than the other NEOs except Mr. Kisber. This practice is consistent with the greater responsibilities of the CEO position, prevalent market practices among our Peer Banks, and our compensation philosophy which endeavors to link a substantial portion of executive pay to performance.
In 2016, salaries for Messrs. Jordan, Losch, and Popwell increased, as discussed in “Salary” below. Except for Mr. Jordan, theThe relative mix of the compensation components for the NEOs did not change in 2016.2017, nor did any NEO receive a salary raise.
Late in 2017 the Committee decided, for 2018, to align the mix of equity award components of all executives (other than Mr. Jordan’s salaryKisber) with that of Mr. Jordan. Accordingly, the 2018 stock awards of all such executives will consist of 50% PSUs (twice the 2017 proportion), 25% RSUs (half the 2017 proportion), and MIP bonus components decreased 3% and 5%, respectively, as a percentage of target total direct compensation, while his equity awards increased a total of 8%25% options (unchanged).
Certain benefits such as life and disability insurance are also related to cash salary. There is no other significant interdependence among the compensation components.
Valuation of Stock Awards
The percentages shown for all regular 20162017 stock awards in the table above are based upon 20162017 salary rates and upon our closing stock price on the grant date, February 11, 2016,10, 2017, which was $11.62$19.73 per share.
In 2016,2017, for purposes of converting the percentages mentioned above into specific share or unit numbers the Committee used the following valuation methods: for RSUs, 100% of market value at grant; for stock options, 25% of market value at grant;; and for PSUs, 82% of market value at grant.86.5%.
RSUs and PSUs. The valuation methods for RSUs and PSUs are consistent with those used for financial reporting purposes. Neither award type is discounted for the risk of forfeiture due to employment termination or non-performance. PSUs in 20162017 were discounted 18%13.5% from target levels for the two-year post-vesting holding period imposed on recipients.
Stock Options. The actual value of a service-vested option cannot be determined in any definitive way. Many commonly used estimation methods, including the method used for financial reporting, were developed in connection with ordinary market trading of short-term options. The Committee believes that those methods overstate the value that an executive generally would ascribe to our long-term, unmarketable options.options with service-vesting requirements. That overstatement partly is
| 54 |
| COMPENSATION DISCUSSION AND ANALYSIS |
structural, given the original usage of those methods, and partly is due to the legacy and environmental factors noted above under the headings “2016 Corporate Performance” and “Industry Operating Environment.”methods. For those reasons, the Committee believes that the relatively simple and stable 25% method it has used for several years provides a more appropriate approximation of value for our option program.
Tally Sheets
The Committee uses a tally sheet tool in considering annual adjustments to executive pay
levels and mix. A sheet for each executive summarizes all major categories of current and recent compensation levels, including the aggregate retention value and duration of unvested awards. Tally sheets are reviewed in conjunction with market data related to each executive position.
Early in the year, the CEO develops a personal plan that contains financial and strategic goals aligned with the Board-approved company plan for the year. The CEO submits that plan to the Committee for review and approval. The Board of Directors also reviews the plan. The Committee reviews the CEO’s achievement of objectives in his personal plan for the preceding year when
assessing the CEO’s salary for the coming year. The Committee also weighs competitive practices within the industry as well as corporate initiatives.
For other NEOs, the Committee approves salaries each year taking the CEO’s recommendations into account.
In 2016, the Committee raised salary rates for Messrs. Jordan (6%), Losch (12%), and Popwell (11%). For all three NEOs, based on analysis of 2015 compensation (the most recent available at the time of the increases), these increases aligned their pay with our Peer Banks. The other two NEOs did not receiveNo NEO received a salary raise in 2016.2017.
Under our shareholder-approved Management Incentive Plan (MIP), the annual bonus opportunity offered to each NEO other(other than Mr. Kisber, (whose MIP bonus isas discussed at the end of this section) is based on targetstarget amounts and performance goals that are approved by the Committee early in that year. Each
Ordinary MIP bonus is based on achievement of company and/or business unit financial targets as well as individual personal plan objectives. For these NEOs, MIP bonus amounts can be adjusted based on several corporate as well as individual performance factors.Bonus
For 2016,2017, similar to the past several years, the Committee established a maximum MIP bonus opportunity per person equal to 2% of adjusted 2016consolidated 2017 pre-tax earnings. Pre-tax earnings and other financial performance measures for 20162017 were required to be adjusted for certain specific items, including changes in accounting principles and certain unusual or non-recurring items, such as litigation settlements. Unlike recent years, which excluded results from our non-strategic segment, for 2016 consolidated resultsThe 2% maximum was to be determined using these “required adjustments”; no discretionary
adjustments were used. allowed in setting the 2% maximum. The required adjustments are similar to, but not the same as, the notable item adjustments presented in Appendix C.
Subject to the 2% maximum, the Committee could exercise negative discretion to determine the final bonus amount.
Early in 2016,2017 the Committee established a gridformulaic structure to guide theits exercise of negative discretion. Individual
bonuses were determined by applying a corporate rating, subject to potential adjustments for various factors, along with an individual rating, to individual target bonus levelsamounts set for each NEO.
The corporate rating, in turn, was drivendetermined by actual adjusted versus budgeted pre-tax earnings for 2016, as shown inadding together an income factor and an efficiency factor; the following table. The earnings levels usedresulting sum was subjected to create the grid were selected to provide an incentive to achieve or exceed budget. Each NEO’s bonus was subject to further adjustments for the results of a multi-point balanced scorecard process (rating the company against those Peer Banks which were independent at year-end 2016), risk management results, quality of earnings, contributions to non-strategic results, and individual personal plan results. Under “quality of earnings” the Committee intended, among other things, to take account of unusual shortfall or windfall in revenues associated with interest rate movements during the year relative to budgetary expectations. All points on the grid and all calculated bonus amounts were subject to further adjustment up or down by the Committee. However, the final bonus paid could not exceed 150% of target.several potential company-wide subjective adjustments. These calculation processes are depicted below:
| 55 |
| COMPENSATION DISCUSSION AND ANALYSIS |
2016 MIP Bonus Calculation Grid
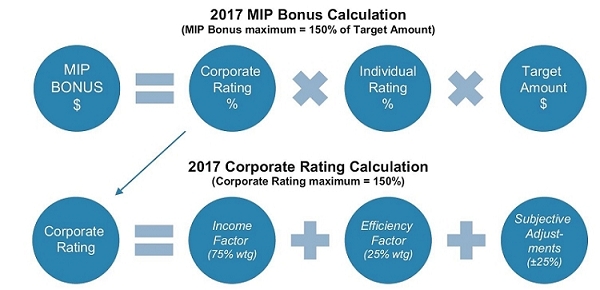
Corporate Rating
|
| ||||||
The income and efficiency factors each were developed to provide target-level rewards for achieving budget, and superior rewards for exceeding budget, in 2017. The specific goals and drivers, relative to budget, are provided in the two tables that follow. The automatic adjustments to the financial performance numbers that were used for the 2% pre-tax earnings maximum mentioned above also were used for these two factors.
Calculation of the income factor was set up to be quantitative, without discretionary input from the Committee. For results at or worse than budget, the efficiency factor likewise was set up in a traditional performance grid. For efficiency results better than budget, however, the Committee wanted to retain full discretionary control over the impact of that factor upon the final bonus.
The two factors were weighted 75% and 25%, respectively. The Committee wanted efficiency outcomes to have a specific and meaningful impact on bonuses, while continuing to emphasize the critical and overall importance of earnings to the company and our shareholders. Specific drivers of the income factor and the efficiency factor are presented in the next two grid tables.
2017 Income Factor Grid (75% Wtg)
| Adj’d 2017 Pre- Tax Earnings | Percent of Budget | Income Factor* |
| $444 million & above | 110% & above | 110% to max of 150% |
| $404-444 million | 100% - 110% | 100% - 110% |
| $404 million (budget) | 100% | 100% |
| $364-404 million | 90% - 100% | 90% - 100% |
| $303-363 million | 75% - 90% | 75% - 90% |
| $202-362 million | 50% - 75% | 50% - 75% |
| Below $202 million | below 50% | 0% |
* Income Factor was interpolated within each row.
2017 Efficiency Factor Grid (25% Wtg)
| Adj’d 2017 Non- Interest Expense (ex Fixed Income) | Percent of Budget | Efficiency Factor* |
| Below $700 million | Below 100%* | max of 150%* |
| $700 million (budget) | 100% | 100% |
| $700-714 million | 100% - 102% | 90% - 100% |
| $714-728 million | 102% - 104% | 75% - 90% |
| Above $728 million | Above 104% | 0% |
| * |
| 56 |
| COMPENSATION DISCUSSION AND ANALYSIS |
Subjective Corporate Rating Adjustments
In 2017 the sum of the income and efficiency factors was subject to several potential subjective adjustments, leading ultimately to the final corporate rating. Overall, the subjective adjustments could have resulted in a change of up to 25%, plus or minus. Potential adjustment categories in 2017 were:
| • | Balanced scorecard results |
| • | Risk management results |
| • | Quality of earnings assessment |
| • | Contributions to non-strategic results |
| • | Other adjustments, as determined by the |
The balanced scorecard used as one of the subjective adjustment factors,process ranked our company among Peer Banks on seventeeneighteen financial measures. The scorecard process used quantitative financial measures and peer rankings, but was not used in a quantitative manner to determine a specific numerical rating. Instead, the Committee considered the scorecard results in a subjective manner.
The Committee also considered risk management qualityfactor was intended to be used if unusual or exceptional events occurred that tested our level of earnings,preparedness, or if events occurred that reflected well or poorly upon our risk management functions.
Under “quality of earnings” the Committee intended, among other things, to take account of unusual shortfalls or windfalls in revenues associated with interest rate movements during the year relative to budgetary expectations.
Our non-strategic segment encompasses several businesses which have been largely discontinued and contributionare being wound down over many years. This segment often has contributed significant expenses to non-strategic outcomes as potentialour operating results, and occasionally significant items of income, during the past several years. Although the income and efficiency factors
exclude these impacts, the Committee retained the ability to adjust bonuses up or down depending upon the Committee’s subjective assessment of how these legacy businesses are managed to mitigate long-term impacts on the company.
All points in this process were subject to further adjustment factors.up or down by the Committee.
Actual corporate adjustments made using this framework are discussed under “2017 MIP Bonus Outcomes” below.
Individual Rating
In 2016,addition to the corporate rating, each NEO’s individual rating could directly impact final bonus results. Each individual rating was to be based on the Committee’s subjective assessment of personal plan results and any other individual factors the Committee chose to consider. Individual ratings could range from 0% to 150%.
In 2017, the CEO’s personal plan included six major performance areas: strategic, financial (structural improvements and revenue growth), customer, shareholder value, employees, and risk management & credit quality. These areas had no particular weighting and were not applied in a quantitative manner.manner except that risk management could affect up to 20 percentage points of the MIP individual rating. Each NEO’s personal plan substantially overlapped the CEO’s and also was related to operations managed by that NEO.
Actual individual rating impacts are discussed under “2017 MIP Bonus Outcomes” immediately below.
2017 MIP Bonus Outcomes
The outcomes of the MIP bonus process for the NEOs other than Mr. Kisber are summarized below.in the following table.
20162017 MIP Bonus Outcomes
| Overall | Bonus | |||||||||||||||||||||||||||||||||||||||||||||||||||||||
| PTE | Impact of | Corporate | Target | Calculated | Individual | Final | ||||||||||||||||||||||||||||||||||||||||||||||||||
| NEO | Rating | Adjustments | Rating | ($) | Bonus ($) | Rating | Bonus ($) | Income Factor | Efficiency Factor | Overall Impact of Adjustments | Corporate Rating | Individual Rating | Bonus Target ($) | Final Bonus ($) | ||||||||||||||||||||||||||||||||||||||||||
| Mr. Jordan | 110 | % | –2 | % | 108 | % | 1,225,000 | 1,323,000 | 100 | % | 1,323,000 | 75 | % | 25 | % | 0 | % | 100 | % | 100 | % | 1,225,000 | 1,225,000 | |||||||||||||||||||||||||||||||||
| Mr. Losch | 110 | % | –2 | % | 108 | % | 475,000 | 513,000 | 100 | % | 513,000 | 75 | % | 25 | % | 0 | % | 100 | % | 111 | % | 475,000 | 525,000 | |||||||||||||||||||||||||||||||||
| Mr. Popwell | 110 | % | –2 | % | 108 | % | 500,000 | 540,000 | 100 | % | 540,000 | 75 | % | 25 | % | 0 | % | 100 | % | 115 | % | 500,000 | 575,000 | |||||||||||||||||||||||||||||||||
| Mr. Tuggle | 110 | % | –2 | % | 108 | % | 427,500 | 461,700 | 100 | % | 461,700 | 75 | % | 25 | % | 0 | % | 100 | % | 100 | % | 427,500 | 427,500 | |||||||||||||||||||||||||||||||||
Pre-tax earnings for 2016,2017, after all required adjustments were made, totaled $359.7about $391 million. ThatThe most significant required adjustment excluded certain expenses for the Capital Bank merger. Adjusted pre-tax earnings resulted in an overall maximum bonus per person
of $4 million (the plan maximum),. Much smaller specific positive and anegative additional quantitative adjustments were made, the two largest of which were to exclude certain charitable contributions motivated in part by tax reform and certain life insurance gains. The net effect was to
| 57 |
| COMPENSATION DISCUSSION AND ANALYSIS |
increase pre-tax earnings (PTE) rating of 110%to $401 million, which was slightly below budget and resulted in an income factor that rounded to 75%. Non-interest expense, excluding our fixed income segment and after all required adjustments, totaled $699 million in 2017. That was slightly better than budget and resulted in an efficiency factor that rounded to 25%.
The Committee determined that the PTE rating should be adjusted down, a total of 2%, for certain small items: add back a litigation settlement taken out as a required adjustment; and remove certain recoveries relatedno subjective adjustments to the non-strategic segment.
The litigation expense arose from circumstances controlled bycorporate rating be made in 2017. Although many aspects of our operating results were outstanding, short-term impacts were significant to our bottom line results. On balance, since the current management team, whichmost impactful events of 2017 are expected to have long-term, rather than short-term, benefits, the Committee believed should be charged against management’sdecided to refrain from any subjective adjustments to the corporate rating for this year. Accordingly, the final corporate rating was 100% (75% plus 25%).
Although the Committee believes our CEO has done an outstanding job, it determined to make no individual adjustment to Mr. Jordan’s 2017 bonus. In significant part, this inaction reflects a difficulty of having a single-year bonus rather than excluded.structure when the most important event of 2017, the Capital Bank merger, will take several years to prove itself.
For bonuses paid to Messrs. Losch and Popwell, the Committee made positive individual adjustments of about 11% and 15%, respectively. The non-strategic recoveries, though positiveCommittee determined that both NEOs performed exceptionally well in 2017 overall, especially in connection with the Capital Bank integration planning and, for corporate earnings, were excluded to be consistent with past exclusions of similar, but negative, non-strategic events in past years.Mr. Popwell, our bank’s excellent performance before considering the merger.
MIP Bonus for FTN Executive
Mr. Kisber is the president of our fixed income business unit (FTN Financial). His bonus for 20162017 was earned under the MIP, but was driven by the overall incentive pool created under the Capital MarketsFTN Financial Incentive Compensation Plan to provide a compensation opportunity consistent with that of competitors in that industry. The incentive pool generally is funded as a specified percentage of divisional net profits, as defined, plus an additional percentage if net profits exceed a specified return on expense.
The structure of Mr. Kisber’s 2016pay package has not changed in many years. His compensation
elements for any given year are paid or grantedduringthat year and the next.
For 2017, Mr. Kisber’s package generally was a percentage15% of the incentive pool, subject to possible reduction approved by the Committee, each year, not to exceed 15% and subject to certain limits imposed by the Committee. The Committee imposed a $6 million overall limitcap on Mr. Kisber’s 2016on the package. The first $2.5 million after salaryEarly in 2018, the fixed income pool for 2017 was to be paid in cash,determined and the next $1.9 million in regular annual stock awards,Committee was to determine Mr. Kisber’s final percentage and anydollar amount. That final dollar amount over that, up to $1 million, was to be allocated and paid, until the final amount was exhausted, in special RSUs (18-month vesting period, settled in cash). the following order:
| • | Salary, paid during 2017: the first $0.6 million |
• | Cash MIP bonus, to be paid in 2018: the next $2.5 million |
| • | Regular annual stock awards, to be granted in 2018: the next $1.9 million |
| • | Special MIP-driven RSUs (18-month vesting period, settled in cash), to be granted in 2018: the last $1.0 million. |
The first $0.5 million of regular stock awards in turn,
were to be granted first inas RSUs, (first $0.5 million), withand any remainder ($1.4(up to $1.4 million) were to be granted 60% in PSUs and 40% in stock options. The Committee treats only the cash and the special RSUs ($3.5 million total) as part of the MIP award, though in fact the entire package after salary is performance-based. The Committee also retainsretained the discretion under the MIP to reduce any calculated bonus amount for Mr. Kisber, but made no reduction for 2016.2017.
Fixed Income’s contribution to our pretax earnings in 2016 was $50.2 million (net of all compensation expense). Mr. Kisber��s earned package for 2016 was $2,500,000 in cash (under the MIP) and $1,258,000 in regular stock awards. The stock awards, granted in 2017 but driven by 2016 performance, consist of RSUs ($500,000), PSUs ($455,000), and stock options ($303,000). Since those regular stock awards were granted in 2017 and are not considered part of his 2016 MIP bonus, they are not reported as part of Mr. Kisber’s 2016 compensation.
package resulted in the grant to him of several stock awards early in 2017. Those grants, for 2016, appear as grants madeOverviewduring 2017 in various tables under “Recent Compensation” beginning on page 66.
In 2016, the CEO’s annual stock award mix was one-halfchart which follows, Mr. Kisber’s potential compensation package for each of the years 2014 through 2017 (far left column) is compared to his actual compensation earned for each of those years, without regard to which year payment or grant occurred. The total value earned has varied over these years, reflecting significant variability in the earnings of our fixed income segment. All dollar values of awards are measured at grant using values assigned by the Committee, as discussed in the “Stock Awards” section beginning on page 59. PSU values granted are shown at 100% of target; actual vesting of PSUs with RSUs and options comprising one-quarter each. For other NEOs except will depends upon company performance relative to applicable PSU performance goals.
| 58 |
| COMPENSATION DISCUSSION AND ANALYSIS |
Mr. Kisber the more heavily weighted component consisted of RSUs. The Committee believes that these mixes provide appropriate incentives to focus on performance goals, especially for the CEO, and to remain with our company.Potential vs Actual Pay Package 2014-2017
($ in thousands)
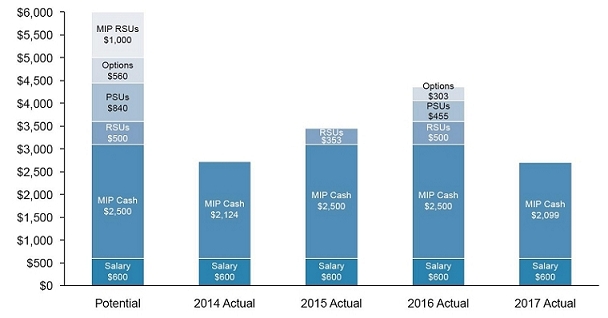
| Our fixed income segment’s contribution to our pretax earnings in 2017, after deducting all compensation, was $24 million. Mr. Kisber’s earned package for 2017 was $2,999,000. Net of salary, his calculated package would have resulted in a cash bonus of $2,399,000 and no stock awards. Although Mr. Kisber’s cash bonus is paid | under our executive MIP, it is funded from our fixed income managers’ bonus pool. In order to increase funds available for manager bonuses from that pool, Mr. Kisber asked the Committee to reduce his 2017 bonus by $300,000. The Committee agreed, and his final bonus for 2017 was $2,099,000, as shown in the chart. | |
| Stock Awards | ||
| Overview | ||
| In 2017, the CEO’s annual stock award mix was one-half PSUs, with RSUs and options comprising one-quarter each. For other NEOs except Mr. Kisber, the more heavily weighted component consisted of RSUs. The Committee believes that these mixes provide appropriate incentives to our NEOs to focus on performance goals and to remain with our company. | The dollar amounts and mix of awards granted in 2017 to the NEOs are illustrated in the following table. Dollar amounts are shown using values assigned by the Committee. PSU values are shown at target levels. Further information about each award type is provided in the remainder of this discussion. |
| 59 |
| COMPENSATION DISCUSSION AND ANALYSIS |
2017 Annual Stock Award Grant Mix
($ in thousands)
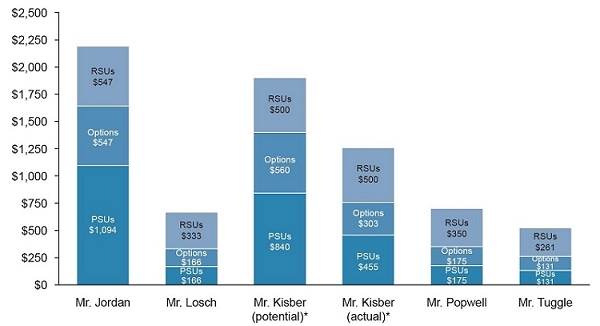
| * | Mr. Kisber’s “potential” column illustrates the maximum potential for annual stock award grants in early 2018 based on 2017 performance, excluding the potential for a special type of RSUs which are treated as part of his MIP bonus. Mr. Kisber’s “actual” column shows the awards he actually received early in 2017, which were based on 2016 performance. See “MIP Bonus—MIP Bonus for FTN Executive” above, and “Stock Awards—Fixed Income Award Practices” and “2017 Grants of Plan-Based Awards” below, for additional information. |
Restricted Stock Units
Regular executive RSUs granted to NEOs vest in March three years after grant if the NEO remains employed with the company through the vesting date. They are settled in shares. Dividends accrue during the vesting period and are paid in cash at vesting.
Stock Options
NEO stock option awards in 20162017 vest in equal installments in March of the first four years following grant if the NEO remains employed with the company through the vesting dates. There is no accrual of cash dividends on options. Each option has a seven-year term and is priced at market at the time of grant. Options will achieve value only to the extent market value on the exercise date exceeds the option price fixed on the grant date.
A stock option provides a retention incentive over its vesting period directly linked to our stock price growth. Options inherently align compensation with the interests of shareholders.
Performance Stock Units
2017 PSUs
Consistent with competitive practice, the Committee makes annual grants of performance equity awards with a three-year performance period. The financial goals established at the beginning of each performance period are company-wide in focus and are uniform for all executives. Grants are annual,made annually, so financial results in any given year can affect three outstanding awards. The Committee sets performance goals each year based on the company’s objectives at that time, and may change the types and amounts of awards compared to prior years based on desired managerial focus, competitive pressures, and other factors.
Payout of 20162017 PSUs will be based on goal achievement as shown in the following chart. Adjusted ROE of our core business segments, averaged over the three-year period 2016-2018,2017-19, will be ranked against the average ROE results of those banks which,that, at the end of the performance period, comprise the KBW Regional Bank Index (ticker symbol KRX). Payout can range from 50% to 150% of the target amount granted, or payout
| 60 |
| COMPENSATION DISCUSSION AND ANALYSIS |
can be zero if performance falls below the 50%
threshold. Dividends accrue until payment but are paid only to the extent the underlying units vest. Performance will be determined in 20182020 but payment will be deferred until 2020.2022.
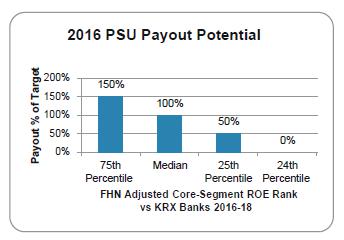
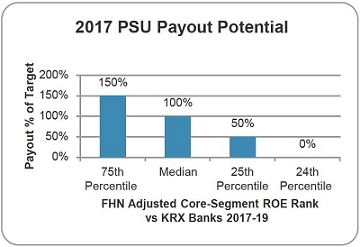
Only whole-year ROE results count in the rankings. The adjustments to our ROE consist of several exclusions includingare the non-strategic segment’s earnings and allocated equity, certain accounting changes, litigation settlements, restructuring or right-sizing expenses, and items describedsame as the required adjustments associated with the 2% maximum under certain specific areas of accounting guidance.the 2017 MIP bonus opportunity, discussed above under “Ordinary MIP Bonus” starting on page 55. The required adjustments are similar to, but not the same as, the notable item adjustments presented in Appendix C.
The KRX banks currently are fifty U.S. regional banks, a wider range of institutions than those in our Peer Bank group used for other purposes. For PSU awards, the Committee believes that an independently-selected basketgroup of competitors like the KRX banks provides a larger, more stable group against which to measure our performance over a three-year period. This rank structure was continued from recent years primarily because the use of a relative-rank goal rather than an absolute measure should provide a better reflection of our results versus competitors. It was chosen in part because of the volatile environment for us and our industry. The awards should self-adapt to industry events whichthat will unfold over a three-year time horizon and which cannot be predicted in advance.
Most Recent PSU Performance
As discussed above, PSUs perform based on our ROE performance ranked against KRX peers. Peer data for a given year is not fully available until the following March. The most recent PSUs with final performance determined were granted in 2014 with a 2014-16 performance period, vesting in 2017. Our adjusted ROE over those three performance years ranked in the top half of the KRX peers. The following table shows the payout of the 2014 PSUs in relation to TSR and our stock price.
| 2014 PSU Statistics | ||
| PSU Payout (% of Target) | 113% | |
| TSR over PSU Lifetime | 158% | |
| FHN Stock Price at Grant | $11.77/share | |
| FHN Stock Price at Vesting | $17.63/share |
Fixed Income Award Practices
The overall amount of annual stock awards granted to Mr. Kisber, the head of our fixed income business, is impacted by the previous year’s results. Early each year, a maximum stock award opportunity is approved by the Committee as part of his entire compensation package, as discussed in “Relative Sizing and Mix” starting on page 47 above. Early in the next year, actual grants are approved which may be less than the opportunity levels, as discussed inSee “MIP Bonus—MIP Bonus for FTN Executive” starting on page 5158 above. The amounts actually granted are based on an assessment of
fixed income results. Quantitative and qualitative factors are considered.
Although Mr. Kisber’s opportunity2016 CEO Retention Award
In February 2016 the Committee approved a special retention award for awards was substantial, as mentioned above, only RSUsour CEO. The award consists of 155,238 seven-year stock units and 411,747 late-vesting stock options.
The units have a 7-year service vesting and financial performance period. The units’ performance goal is met if the TSR value of a share of our stock during the seven-year period is at least $11.63/share, which is slightly higher than market value on the grant date.
The stock options were granted at-market with service vesting in 2020, 2021, and 2022, or four, five, and six years after grant. The options expire in 2023, seven years after grant.
The Committee wanted this award to him in early 2016 (shownhave substantial retention value as well as a strong linkage to shareholder value. The entire award continues to be at-risk for the market performance of our common stock during its seven-year duration. In making this award the Committee wanted to close a gap it perceived in the Summary Compensation Table on page 58). His awards in 2016, though higher than in 2015, were well belowcompetitiveness of Mr. Jordan’s target compensation and the maximum possible dueretention value of his outstanding awards. The Committee believes that Mr. Jordan’s leadership and experience have been critical to the revenuesour company’s recent successes and earnings achieved by our fixed income business segment in 2015will remain crucial in the face of unfavorable market conditions. As mentioned in “MIP Bonus for FTN Executive” (page 51 above), Mr. Kisber’s stock awards in 2017, relatedyears to 2016 performance, were substantially larger than in 2016 or 2015.come.
2012 CEO Retention Award
In May 2012 the Committee granted our CEO a special performance-based retention award. The award consistsconsisted of PSUs covering $3 million of stock (valued at grant) with a highly challenging goal. The award will vest and paywould have vested if our stock price achieveshad achieved $20/share for an entire 60 trading-day (3 month) periodconsecutive trading days before the fifth anniversary of grant, or if the TSR value of a share of our stock measured at the end of those five years ishad been at least $20/share. Our stock value at grant was $9.22
| 61 |
| COMPENSATION DISCUSSION AND ANALYSIS |
$9.22 per share, so to achieve either of those alternative goals our stock value had to more than double in five years.
At the time of grant the Committee considered thesethose goals to be appropriately challenging. The low interest rate and subdued economic environments, along with continued drag from our exited “non-strategic” businesses, created substantial challenges to achieving the kind of sustained stock value growth necessary to meet either of the goals.
The 2012 award has not yet vested or forfeited; the performance period will end on May 7, 2017. It is no longer possible to achieve the $20-for-60-days goal; however, it is reasonably possible that the TSR goal will be met.
TSR value isfor this award was measured using a starting value ($9.22)9.22, our stock price at grant), a
closing value ($18.41, our average stock price at the end of the award’s term), and an assumed reinvestment of actual dividends since grant. For
The performance period ended on May 7, 2017. Although our stock price early in 2017 was above $20, in the end neither goal was met and the award forfeited. The final TSR value for this award was $19.88. Although an investment in our shares would have increased in value by 216% during the PSU’s lifetime, final TSR was twelve cents below what was needed for payout.
In October 2017 the Compensation Committee approved a special cash bonus for our CEO, Bryan Jordan, of $5.5 million. Committee members discussed the bonus with the entire Board of Directors in executive session. By making this award the 20 trading-day (one month) average priceCommittee, and the entire Board, recognized and rewarded our CEO for the extraordinary overall performance our company has achieved over the past six years. That performance has resulted in exceptional wealth creation for each shareholder who owned our stock before 2012 and still owns it today.
The bonus was discretionary. The Committee assessed our long-term performance qualitatively, but also took into account quantitative performance measures. The section captioned “First Horizon Transformation Since 2007,” beginning on page 44, outlines major events since the recession. For this bonus, the Committee focused on the period after the financial crisis ended. Six years ago, at the end of 2011, our company was in stable condition but with significant headwinds and turbulence, impeding efforts to grow our business, our earnings prospects, and our stock value. At that time, we had been out of the performance period will be usedTARP program for a year; loan growth and interest margins were low; and we had significant potential liability exposures from discontinued businesses dealing with mortgages, much larger than those of our peers. Our stock value had declined each of the previous two years (by over one-third, in placetotal), reflecting the market’s judgment that our prospects were unclear and our risks were high. For similar reasons, it was difficult to engage in serious pursuit of a single-day price.strategic acquisitions.
As measuredOur management team’s focus then, as now, was to control what could be controlled while resolving the legacy issues as optimally as possible. The
focus on March 1, 2017 (shortlycontrollable items resulted in several key, broad initiatives:
| • | grow loan and deposit relationships by emphasizing, with all employees, the importance of superior customer service; |
| • | grow loans and defend margins by penetrating and developing higher-profit market niches, which we call our specialty lending areas; |
| • | exercise discipline in making acquisitions in terms of price, business “fit,” and post-closing execution; |
| • | create a culture which seeks always to spend less while maintaining service and profitability levels, and to spend more only when revenue prospects warrant; and |
| • | manage the entire enterprise using metrics which focus on returns in relation to invested capital and risk, so that capital-inefficient activities, and those with risk-reward imbalances, are curtailed while efficient activities with acceptable risk are nurtured. |
Starting before printing this proxy statement), TSR value had improved substantially2011, but especially since then, these and similar initiatives have been transformational. Loans and deposits in our regional banking segment have grown significantly and steadily, more than offsetting significant run-off of legacy business in the non-strategic segment. Although total expenses have been volatile, controllable expenses, especially those in the banking segment, have been cut while earnings have grown. Not all controllable expenses are down—costs associated with driving higher revenues or efficiencies are up in many cases, but only after management assesses the ability of those costs to $22.31. Our stock price then was $20.76/share. If the 20-day average stock price usedmore than pay for this award turns outthemselves. The steady and still-compounding successes in these and other areas:
| 62 |
| COMPENSATION DISCUSSION AND ANALYSIS |
same as the March 1 price, performance will significantly exceed the TSR goal.
As mentioned above in “CEO Pay and Performance,” in the TSR chart on page 42, our TSR percentage for the five calendar years ending with 2016 is 269%. The Committee believes our overall business performance over the past five years has been excellent, as reflected in the consistent rise in our stock value each year and the outstanding TSR value that has produced to date. While the performance period for the 2012 award has not fully run and final performance results cannot yet be determined, the Committee is pleased with the significant growth in shareholder value, and the achievement of the award’s TSR performance goal, which we have achieved to date.
2016 CEO Retention Award
In February 2016, the Committee approved a special retention award for our CEO. The award consists of 155,238 special retention stock units and 411,747 stock options.
The units have a 7-year service vesting and performance period. The units’ performance goal is met if the TSR value of a share of our stock during the seven-year period is at least $11.63/share, which is slightly higher than our shares’ market value on the grant date.
The stock options were granted at-market with service vesting in 2020, 2021, and 2022. The options expire in 2023, seven years after grant.
| 2012 to 36 cents annually in 2017 (48 cents in 2018); | |
| • | resulted in our stock price increasing from $8.00 per share at year-end 2011 to $19.29 per share on October 20, 2017, the last trading day before the Committee meeting; |
| • | for an investor who owned 1,000 shares in 2011 with dividends reinvested, grew that investment from $8,000 to more than $21,000; and |
| • | positioned us to pursue seriously and then successfully close our merger in 2017 with Capital Bank Financial. |
The Committee wanted thisalso considered the forfeiture of the 2012 special PSUs, discussed above. In the Committee’s view, under Mr. Jordan’s leadership the company and its shareholders obtained an extraordinary gain in share value. That gain fell just short of the aggressive goal established in that award. Because that award to have substantial retention value as well as a strong linkage to shareholder value. In making this award to Mr. Jordan,forfeited, the Committee wanted to close the gap it perceived at that time in the competitiveness of his target compensation and the retention value of his outstanding awards relative to the risk that another company might try to recruit him. The Committee believesfelt that Mr. Jordan’s leadershipexceptional performance, directly benefiting all shareholders, was not properly being recognized and experience have been critical to our company’s recent successes and will remain crucial in the years to come.rewarded.
Deferral, Retirement, and Other Benefits
Benefits other than Change in Control
We provide retirement and other post-employment benefits that we believe are customary in our industry. We provide them to remain competitive in retaining and recruiting talent. The table below summarizes the major types of benefits provided to
NEOs. Many of these benefits are broad-based and so available to most or all full-time employees, and many others are available generally to employees whose compensation levels exceed certain thresholds, regardless of officer status.
Deferral, Retirement, and Other Benefits Summary
| Benefit | Type | Benefit Provided | Further Information | |||
| Savings Plan (broad-based) | Tax-qualified defined contribution (retirement savings) | Participants may defer a portion of salary into a fully funded tax-advantaged savings account, up to IRS dollar limits. We provide a 100% match on the first 6% of salary deferred. | Match amounts for the NEOs are included in column (i) of the Summary Compensation Table on page | |||
| Savings Restoration Plan | Non-qualified deferral | Provides a restorative benefit to savings plan participants whose compensation exceeds IRS limits, as if the savings plan were not subject to those limits. | Restoration match amounts for the NEOs are included with savings plan match amounts; see the row above. Match amount and withdrawal information is provided under “Non- Qualified Deferred Compensation Plans” beginning on page |
| 63 |
| COMPENSATION DISCUSSION AND ANALYSIS |
| Benefit | Type | Benefit Provided | Further Information | |||
| Deferred Compensation Plan | Non-qualified deferral | Participants may defer payment of a portion of salary, bonus, and other cash compensation. Taxation is deferred until paid. There is no company match. The plan pays at-market returns indexed to the performance of certain mutual funds selected by the participant. We hedge this obligation by purchasing those funds. | Deferral and withdrawal information for the NEOs, along with other plan information, is provided under “Non-Qualified Deferred Compensation Plans” beginning on page | |||
| Pension Plan (broad-based) | Tax-qualified defined benefit (retirement) | Participants earned a defined retirement benefit dependent mainly on salary level (up to IRS limits) and tenure. The plan was closed to new hires after August 31, 2007; the benefit was frozen at year-end 2012. | Pension benefit information for the NEOs, along with other plan information, is provided under “Pension Plans” beginning on page | |||
| Pension Restoration Plan | Non-qualified defined benefit (retirement) | Provides a restorative benefit to pension plan participants. The two plans work together as if the IRS limits did not exist. | Restoration benefits and value changes are included with those of the pension plan; see the row above. |
| Health & Welfare programs | Cafeteria benefit program | Employees may elect annually to participate in several programs such as health and dental insurance, vision, dependent care, etc. We provide an allowance for this purpose based on salary, tenure, and certain wellness incentives, subject to IRS limits. A participant may elect to use any leftover allowance for the savings plan. | The amounts of these | |||
| Survivor Benefit Plan | Death benefit | Provides a benefit of 2.5 times base salary if death occurs during active service, which is reduced to 1.0 times salary if death occurs following departure due to disability or retirement. This executive benefit substitutes for a broad-based survivor benefit. | Cost amounts for the NEOs are included in column (i) of the Summary Compensation Table on page |
| 64 |
| COMPENSATION DISCUSSION AND ANALYSIS |
| Benefit | Type | Benefit Provided | Further Information | |||
| Executive disability program | Disability benefit | The executive benefit cap is $25,000 per month. An executive may elect to purchase, with personal funds, an additional disability benefit of up to $5,000 per month. This executive benefit substitutes for a broad-based survivor benefit. | Cost amounts for the NEOs are included in column (i) of the Summary Compensation Table on page | |||
| Other Perquisites | Misc. | We provide a limited range of other executive perquisites | Cost amounts for the NEOs are included in column (i) of the Summary Compensation Table on page |
Change in Control (CIC) Benefits
Since the mid-1980s theThe financial services industry has experiencedexperiences periods of significant consolidation.consolidation separated by periods of modest activity. Merger activity abated substantially following the last recession, but activity excluding(excluding the four largest U.S. banksbanks) resumed several years ago. Although this industry pattern has resumed in the past few years. Although these circumstances have created substantial business opportunities for
us and others, they haveit also has created substantial personal uncertainties for employees. Our CIC severance agreements and CIC plan features were put in place a number of years ago in response to these uncertainties.
We have CIC severance agreements with each NEO other than Mr. Kisber.NEO. These are not employment agreements. They provide significant benefits if employment is terminated in connection with a CIC event, but otherwise provide no employment protection. Additional information about these contracts is provided under the caption “Change in Control“CIC Severance Agreements” in the “Change in Control (CIC) Arrangements”Control” section beginning on page 6978 of this proxy statement.
The primary objectives of our CIC severance agreements are to allow us to compete for executive talent during normal times, mitigating the personal risk that a CIC would present. If a CIC situation were to arise, the agreements also provide an incentive for our executive team to
remain with the company, focused on corporate objectives, during the pursuit, closing, and transition periods that accompany CIC transactions in our industry.
Under many of our programs a CIC event can cause awards or benefits to vest, be paid, or be calculated and paid at target payout levels. The main objective of these features is to allow us to offer competitive compensation packages in an industry where robust periods of consolidation occur. Like our CIC severance agreements, these program features have a double trigger, which means that vesting or payment is accelerated only when a CIC event occurs resulting in termination of employment.
The Compensation Committee Report is located on page 21 of this proxy statement under the caption “The Compensation Committee.”
| 65 |
| RECENT COMPENSATION |
This Recent Compensation section provides detailed information about the compensation paid to our named executive officers in 2016.2017. This section should be read in conjunction with the immediately preceding Compensation Discussion and Analysis section.
20162017 Direct Compensation Actually Paid
A comprehensive Summary Compensation Table, along with detailed footnotes and commentary, is presented in the next several sections. To provide context for that information, the following chart shows direct compensation amounts actually paid in 20162017 to our named executive officers, except that the 20162017 MIP bonus (which was paid early in
2017)2018) is included rather than any earlier bonus. Direct compensation components include salary, bonus paid, and stock awards vested. For this purpose, amounts are considered “paid” if they were paid or deferred on a fully-vested basis. All amounts are shown before reduction for withholding taxes and other payroll deductions.
20162017 Direct Compensation Actually Paid
($ in millions)millions)
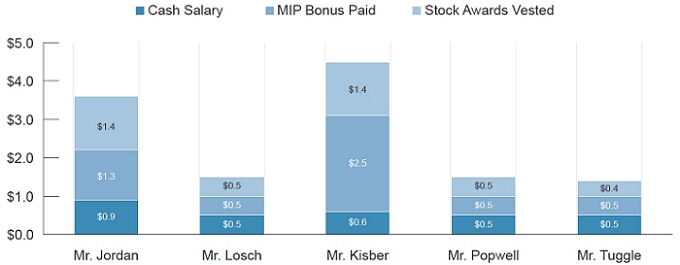
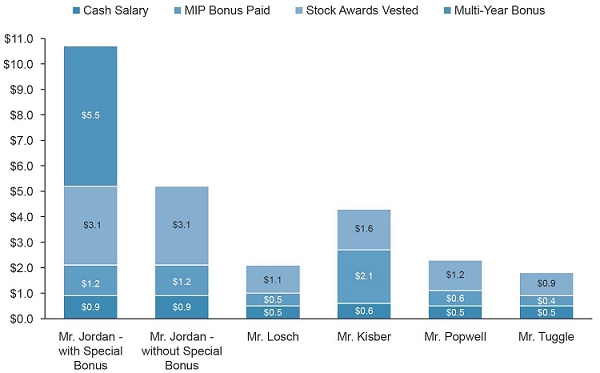
Key details regarding the segments in this chart follow:
| • | |
| • | Stock Awards Vested. Awards vested in |
| options. Values are based on the market price of our stock on the vesting date. Stock options are valued based on the “spread” at vesting, which |
| is the difference between market price at that time and the option price; any negative spreads at vesting are ignored. | |
| • | Multi-Year Bonus for |
| 66 |
| RECENT COMPENSATION |
Summary Compensation & Award Grant Tables
The amounts shown in the Summary Compensation Table include all compensation earned for 2016,2017, including amounts deferred by those persons for all services rendered in all capacities to us and our subsidiaries. Compensation amounts from the past two years
are also included. Additional compensation information is provided in the remainder of this section. No named executive officer who served as a director was separately compensated as a director.
Summary Compensation Table 2015-2017
| (a) | (b) | (c) | (d) | (e) | (f) | (g) | (h) | (i) | (j) | |||||||||||||||||||||||
| Name and Principal Position | Year | Salary ($) | Bonus ($) | Stock Awards* ($) | Option Awards ($) | Non-Equity Incentive Plan Compensa- tion ($) | Change in Pension Value & NonQualified Deferred Compensation Earnings* ($) | All Other Compensation ($) | Total ($) | |||||||||||||||||||||||
| D.B. Jordan | 2016 | $ | 868,654 | — | $ | 2,736,995 | $ | 1,768,560 | $ | 1,323,000 | $ | 225,014 | $ | 88,227 | $ | 7,010,450 | ||||||||||||||||
| Chairman, | 2015 | 815,000 | — | 1,144,893 | 429,016 | 1,155,000 | — | 81,582 | 3,625,491 | |||||||||||||||||||||||
| President, & | 2014 | 760,000 | — | 1,054,486 | 418,371 | 904,400 | 243,395 | 97,485 | 3,478,137 | |||||||||||||||||||||||
| CEO | ||||||||||||||||||||||||||||||||
| W.C. Losch | 2016 | $ | 468,654 | — | $ | 498,804 | $ | 168,685 | $ | 513,000 | $ | — | $ | 42,329 | $ | 1,691,472 | ||||||||||||||||
| EVP & CFO | 2015 | 425,000 | — | 604,276 | 167,247 | 425,000 | — | 41,382 | 1,662,905 | |||||||||||||||||||||||
| 2014 | 425,000 | — | 398,415 | 158,080 | 361,250 | — | 47,732 | 1,390,477 | ||||||||||||||||||||||||
| M.E. Kisber | 2016 | $ | 600,000 | — | $ | 352,992 | $ | — | $ | 2,500,000 | $ | 65,990 | $ | 50,347 | $ | 3,569,329 | ||||||||||||||||
| President– | 2015 | 600,000 | — | — | — | 2,500,000 | — | 48,917 | 3,148,917 | |||||||||||||||||||||||
| FTN Financial | 2014 | 600,000 | — | 509,994 | 404,684 | 2,124,000 | 185,746 | 109,308 | 3,933,732 | |||||||||||||||||||||||
| D.T. Popwell | 2016 | $ | 493,654 | — | $ | 525,050 | $ | 177,563 | $ | 540,000 | $ | 49,306 | $ | 59,959 | $ | 1,845,532 | ||||||||||||||||
| President– | 2015 | 450,000 | — | 672,517 | 177,086 | 450,000 | — | 53,853 | 1,803,456 | |||||||||||||||||||||||
| Banking | 2014 | 450,000 | — | 421,860 | 167,375 | 400,000 | 144,163 | 67,663 | 1,651,061 | |||||||||||||||||||||||
| C.T. Tuggle | 2016 | $ | 475,000 | — | $ | 391,905 | $ | 132,539 | $ | 461,700 | $ | 9,750 | $ | 40,883 | $ | 1,511,777 | ||||||||||||||||
| EVP & General | 2015 | 475,000 | — | 391,896 | 146,868 | 427,500 | — | 38,343 | 1,479,607 | |||||||||||||||||||||||
| Counsel | 2014 | 475,000 | — | 338,411 | 134,275 | 363,000 | 208,636 | 51,266 | 1,570,588 | |||||||||||||||||||||||
| (a) | (b) | (c) | (d) | (e) | (f) | (g) | (h) | (i) | (j) | |||||||||||||||||||||||||||
| Name and Principal Position | Year | Salary ($) | Bonus* ($) | Stock Awards ($) | Option Awards ($) | Non-Equity Incentive Plan Compensation ($) | Change in Pension** Value & NonQualified Deferred Compensation Earnings ($) | All Other Compensation ($) | Total ($) | |||||||||||||||||||||||||||
| D.B. Jordan | 2017 | $ | 875,000 | $ | 5,500,000 | $ | 1,640,822 | $ | 520,273 | $ | 1,225,000 | $ | 479,791 | $ | 92,879 | $ | 10,333,765 | |||||||||||||||||||
| Chairman, | 2016 | 868,654 | — | 2,736,995 | 1,768,560 | 1,323,000 | 225,014 | 88,227 | 7,010,450 | |||||||||||||||||||||||||||
| President, & CEO | 2015 | 815,000 | — | 1,144,893 | 429,016 | 1,155,000 | — | 81,582 | 3,625,491 | |||||||||||||||||||||||||||
| W.C. Losch | 2017 | $ | 475,000 | — | $ | 498,769 | $ | 158,164 | $ | 525,000 | $ | — | $ | 43,885 | $ | 1,700,818 | ||||||||||||||||||||
| EVP & CFO | 2016 | 468,654 | — | 498,804 | 168,685 | 513,000 | — | 42,329 | 1,691,472 | |||||||||||||||||||||||||||
| 2015 | 425,000 | — | 604,276 | 167,247 | 425,000 | — | 41,382 | 1,662,905 | ||||||||||||||||||||||||||||
| M.E. Kisber | 2017 | $ | 600,000 | — | $ | 954,879 | $ | 288,449 | $ | 2,099,000 | $ | 121,354 | $ | 49,632 | $ | 4,113,314 | ||||||||||||||||||||
| President– | 2016 | 600,000 | — | 352,992 | — | 2,500,000 | 65,990 | 50,347 | 3,569,329 | |||||||||||||||||||||||||||
| FTN Financial | 2015 | 600,000 | — | — | — | 2,500,000 | — | 48,917 | 3,148,917 | |||||||||||||||||||||||||||
| D.T. Popwell | 2017 | $ | 500,000 | — | $ | 525,026 | $ | 166,484 | $ | 575,000 | $ | 86,332 | $ | 62,223 | $ | 1,915,065 | ||||||||||||||||||||
| President– | 2016 | 493,654 | — | 525,050 | 177,563 | 540,000 | 49,306 | 59,959 | 1,845,532 | |||||||||||||||||||||||||||
| Banking | 2015 | 450,000 | — | 672,517 | 177,086 | 450,000 | — | 53,853 | 1,803,456 | |||||||||||||||||||||||||||
| C.T. Tuggle | 2017 | $ | 475,000 | — | $ | 391,882 | $ | 124,269 | $ | 427,500 | $ | 82,935 | $ | 41,172 | $ | 1,542,758 | ||||||||||||||||||||
| EVP & General | 2016 | 475,000 | — | 391,905 | 132,539 | 461,700 | 9,750 | 40,883 | 1,511,777 | |||||||||||||||||||||||||||
| Counsel | 2015 | 475,000 | — | 391,896 | 146,868 | 427,500 | — | 38,343 | 1,479,607 | |||||||||||||||||||||||||||
| * | In October 2017 Mr. Jordan received a special cash bonus in recognition of outstanding performance over the past six years. See “CEO Multi-Year Cash Bonus” beginning on page 62. | |
| ** | In this column negative values are ignored rather than netted. For Messrs. Jordan, Kisber, and Popwell, actual pension value changes for 2015 were negative: ($39,521), ($28,213), and ($21,405), respectively. |
Explanations of certain columns follow:
Col (c) Salary. Annual cash salary is shown.
Col (d) Bonus. No discretionary bonuses were paid to the named executive officers. Column (g) shows the annual MIP bonus awards earned. Mr. Jordan was paid a discretionary special bonus in October 2017 to recognize outstanding performance over the past six years, as discussed in “CEO Multi-Year Cash Bonus” beginning on page 62.
Cols (e)-(f) Accounting Values. Columns (e) and (f) show the grant date fair value of the awards using the accounting method applicable to our financial statements. The accounting valuation method makes assumptions about growth and
volatility of our stock value, expected duration in the case of options, vesting, forfeiture, future company performance, and other matters. A discussion of those assumptions appears in note 19 to our 20162017 annual report to shareholders. Actual future events may be substantially inconsistent with the assumptions. Accordingly, the actual values realized by an award holder are
likely to differ substantially from these accounting values.
Col (e) Stock Awards. Column (e) includes the accounting values of RSU, PSU, and retention RS awards granted during each year. These do not represent amounts paid or earned; they are
| 67 |
| RECENT COMPENSATION |
the values attributed to awards under applicable accounting rules.
Col (e) Regular PSUs. PSUs are performance-based, using a three-year performance period. Eventual payout may be higher or lower than the accounting values used in column (e), and may be zero. PSUs also have a service-vesting requirement. PSUs granted after 2014 also have a mandatory two-year deferral period after vesting. Generally, PSU performance depends upon our adjusted core-segment ROE ranking relative to certain peer banks during the performance period. For 2014, a second type of PSU was granted
(20% of the total that year), the performance of which depended upon the Committee’s subjective assessment of total corporate performance as well as individual performance over that performance period (2014-16). In all cases,Each year, a percentage of PSUs (50% to 150%) will vest if threshold or higher performance goals are achieved during the performance period and if the holder remains employed with the company through the vesting date. PSUs settle with shares rather than cash. In column (e) PSU amounts are shown at their original accounting values assigned at grant. Those accounting values are less than the possible payouts if all performance conditions are maximally achieved. The following table provides a summary of the maximum payouts of the regular annual PSU awards for each named executive, based on our stock values on the respective grant dates.
Maximum Dollar Values* of Regular PSUs
(Based on Share Price at Grant Date)
| Name | 2014 | 2015 | 2016 | 2015 | 2016 | 2017 | |||||||||||||||||
| Mr. Jordan | $ | 1,054,486 | $ | 1,144,996 | $ | 1,641,213 | $ | 1,144,996 | $ | 1,641,213 | $ | 1,640,956 | |||||||||||
| Mr. Losch | 199,207 | 223,186 | 249,465 | 223,186 | 249,465 | 249,427 | |||||||||||||||||
| Mr. Kisber | 764,991 | — | — | — | — | 682,322 | |||||||||||||||||
| Mr. Popwell | 210,930 | 236,306 | 262,584 | 236,306 | 262,584 | 262,554 | |||||||||||||||||
| Mr. Tuggle | 169,194 | 195,993 | 196,000 | 195,993 | 196,000 | 195,964 | |||||||||||||||||
| * | Maximum dollar values = 150% of target unit levels for all years presented valued at grant date fair value. Actual maximum values depend upon our actual stock price when paid. |
Col (e) Regular RSUs. Since 2014 the annual equity award package has included RSUs which vest in three years and settle in shares.
Col (e)-(f) Retention AwardsAwards.. On occasion special retention awards are made to selected individuals.
In 2015, retention RS awards were granted to Messrs. Losch and Popwell. They vest five years after grant.
In 2016, retention stock units (col (e)) and stock options (col (f)) were granted to Mr. Jordan. The stock units have a seven-year service-vesting and performance period. The option price was set at our market price on the grant date. The retention options have a seven-year term and vest in equal parts four, five, and six years after grant.
Col (f) Stock Options. Column (f) includes the accounting values of stock options granted.
Col (g) Annual MIP Bonus Awards. This column shows the annual bonus earned for each year under our MIP. For all three years, MIP bonuses (except for Mr. Kisber) were based upon achievement in the following areas: pre-set levels of adjusted annual pre-tax earnings (core-segment earnings for 2014 and 2015, consolidated for 2016)2016 and 2017); execution of personal plan goals; and individual contribution to risk management, quality of earnings, and objectives for our non-strategic business segment; and the results of a balanced scorecard process ranking us among selected peer banks on a matrix of balance sheet, capital, expense, earnings, and other measures. Mr. Kisber’s bonuses were based on the net profits of our FTN Financial division, of which he is the President. For any given year, FTN net profits also drove stock awards granted to Mr. Kisber the following year.
Col (h) Pension & Deferred CompensationCompensation.. Column (h) includes changes in defined benefit pension actuarial values, which are the aggregate increase during the year in actuarial value of both pension plans (qualified and restoration). Our pension plans were closed to new employees in 2007. Mr. Losch does not participate. Pension benefits were frozen in 2012. Incremental changes in actuarial pension values occur after 2012 mainly due to changes in discount rates used, changes in mortality tables, and changes to life expectancy due to the passage of time. No above-market earnings on deferred compensation were accrued during the year for any of the named executives.
| 68 |
| RECENT COMPENSATION |
Col (i) All Other.Other Compensation. Elements of “All Other Compensation” for 20162017 consist of the following:
All Other Compensation (Col (i)) for 20162017
| (i)(a) | (i)(b) | (i)(c) | (i)(d) | ||||||||||||||
| Name | Perquisites & Other Personal Benefits | 401(k) Match | Life Insur. Prems. | Total Col (i) | |||||||||||||
| Mr. Jordan | $ | 26,522 | $ | 52,859 | $ | 8,846 | $ | 88,227 | |||||||||
| Mr. Losch | 8,001 | 28,892 | 5,435 | 42,328 | |||||||||||||
| Mr. Kisber | 6,120 | 36,715 | 7,512 | 50,347 | |||||||||||||
| Mr. Popwell | 23,802 | 30,335 | 5,822 | 59,959 | |||||||||||||
| Mr. Tuggle | 22,175 | 13,142 | 5,565 | 40,882 | |||||||||||||
| (i)(a) | (i)(b) | (i)(c) | (i)(d) | |||||||||||||
| Name | Perquisites & Other Personal Benefits | 401(k) Match | Life Insurance Premiums | Total Col (i) | ||||||||||||
| Mr. Jordan | $ | 31,533 | $ | 52,500 | $ | 8,846 | $ | 92,879 | ||||||||
| Mr. Losch | 9,820 | 28,500 | 5,565 | 43,885 | ||||||||||||
| Mr. Kisber | 6,120 | 36,000 | 7,512 | 49,632 | ||||||||||||
| Mr. Popwell | 26,271 | 30,000 | 5,952 | 62,223 | ||||||||||||
| Mr. Tuggle | 23,307 | 12,300 | 5,565 | 41,172 | ||||||||||||
Explanations of certain columns in the Col (i) table follow:
Col (i)(b) “Perquisites and Other Personal Benefits” includes the following types of benefits: Flexible Dollars,Dollars; Financial Counseling,Counseling; Disability Insurance,Insurance; and Aircraft Usage. Benefits are valued at the incremental cost to us. “Flexible Dollars” represents our contribution to our broad-based benefits plan, a qualified cafeteria-type benefit plan. “Financial Counseling” represents payments for the preparation of income tax returns and related financial counseling. “Disability Insurance” represents insurance premiums with respect to our disability program. “Aircraft Usage” represents imputed income to the executives when their spouses accompany them on a business trip using non-commercial aircraft. This column also includes
imputed taxable income from our company-wide
wellness program, and (for Mr. Jordan) the cost of participating in the Mayo Clinic Executive Health Program. The Board of Directors requires Mr. Jordan to participate in the Mayo program.
Col (i)(c) “401(k) Match” represents our matching contribution to our 401(k) savings plan and to the related savings restoration plan. Any flexible benefits plan contributions to the savings plan are included in column (i)(b).
Col(i)(d) “Life Insurance Premiums” represents supplemental life insurance premiums. Under our survivor benefits plan a benefit of 2.5 times annual base salary is paid in a lump sum ifupon the participant’s death occurs prior to retirement. The benefit isretirement, or one times final salary payable in equal annual installments over ten years, ifupon death occurs after retirement.
20162017 Grants of Plan-Based Awards
The following table provides information about the MIP bonus opportunity established for, and the grants of PSUs, stock options, RSUs, and retention awards during, 2016.2017. In this table the MIP bonus opportunity is considered a “Non-Equity Incentive Plan Award,” PSUs are considered to be
“Equity Incentive Plan Awards,” while RSUs are considered to be “All Other Stock Awards.” In the table each row represents a separate award grant. Agrant; a column for a row is blank if it does not apply to the type of award listed in that row or if the dollar amount is $0.
| 69 |
| RECENT COMPENSATION |
Awards Granted in 20162017
| (a) | (b) | (c) | (d) | (e) | (f) | (g) | (h) | (i) | (j) | (k) | (l) | (b) | (c) | (d) | (e) | (f) | (g) | (h) | (i) | (j) | (k) | (l) | ||||||||||||||||||||||||||||||||||||||||||||||||||||||||||||||
| Estimated Possible Payouts under Non-Equity Incentive Plan Awards | Estimated Future Payouts under Equity Incentive Plan Awards | All Other Stock Awards: Number of Shares of Stock | All Other Option Awards: Number of Securities Underlying | Exercise price of Option | Grant date Fair Value of Stock | Estimated Possible Payouts under Non-Equity Incentive Plan Awards | Estimated Future Payouts under Equity Incentive Plan Awards | All Other Stock Awards: Number of Shares of Stock | All Other Option Awards: Number of Securities Underlying | Exercise Price of Option | Grant Date Fair Value of Stock | |||||||||||||||||||||||||||||||||||||||||||||||||||||||||||||||||||||||||
| Name | Award | Grant Date | Threshold ($) | Target ($) | Maximum ($) | Threshold (#) | Target (#) | Maximum (#) | or Units (#) | Options (#) | Awards ($/sh) | and Option Awards($) | Award | Grant Date | Threshold ($) | Target ($) | Maximum ($) | Threshold (#) | Target (#) | Maximum (#) | or Units (#) | Options (#) | Awards ($/sh) | and Option Awards($) | ||||||||||||||||||||||||||||||||||||||||||||||||||||||||||||
| Mr. Jordan | MIP | 2-11 | $612,500 | $ | 1,225,000 | $ | 1,837,500 | NA | MIP | 2-10 | $612,500 | $ | 1,225,000 | $ | 1,837,500 | NA | ||||||||||||||||||||||||||||||||||||||||||||||||||||||||||||||||||||
| Opt | 2-11 | 188,253 | $ | 11.62 | $ | 554,895 | ||||||||||||||||||||||||||||||||||||||||||||||||||||||||||||||||||||||||||||||
| PSU | 2-11 | 57,046 | 114,092 | 171,138 | 1,094,142 | |||||||||||||||||||||||||||||||||||||||||||||||||||||||||||||||||||||||||||||||
| RSU | 2-11 | 47,063 | 546,872 | Opt | 2-10 | 110,871 | $19.73 | $ | 520,273 | |||||||||||||||||||||||||||||||||||||||||||||||||||||||||||||||||||||||||||
| Ret SU | 2-11 | NA | NA | 155,238 | 1,095,980 | PSU | 2-10 | 32,044 | 64,087 | 96,131 | 1,093,965 | |||||||||||||||||||||||||||||||||||||||||||||||||||||||||||||||||||||||||
| Ret Opt | 2-11 | 411,747 | $ | 11.62 | 1,213,665 | RSU | 2-10 | 27,717 | 546,856 | |||||||||||||||||||||||||||||||||||||||||||||||||||||||||||||||||||||||||||
| Mr. Losch | MIP | 2-11 | $237,500 | $ | 475,000 | $ | 712,500 | NA | MIP | 2-10 | $237,500 | $ | 475,000 | $ | 712,500 | NA | ||||||||||||||||||||||||||||||||||||||||||||||||||||||||||||||||||||
| Opt | 2-11 | 57,228 | $ | 11.62 | $ | 168,685 | Opt | 2-10 | 33,705 | $19.73 | $ | 158,164 | ||||||||||||||||||||||||||||||||||||||||||||||||||||||||||||||||||||||||
| PSU | 2-11 | 8,671 | 17,342 | 26,013 | 166,310 | PSU | 2-10 | 4,871 | 9,741 | 14,612 | 166,279 | |||||||||||||||||||||||||||||||||||||||||||||||||||||||||||||||||||||||||
| RSU | 2-11 | 28,614 | 332,495 | RSU | 2-10 | 16,852 | 332,490 | |||||||||||||||||||||||||||||||||||||||||||||||||||||||||||||||||||||||||||||
| Mr. Kisber | MIP | 2-11 | NA | NA | $ | 3,500,000 | NA | MIP | 2-10 | NA | NA | $ | 3,500,000 | NA | ||||||||||||||||||||||||||||||||||||||||||||||||||||||||||||||||||||||
| RSU | 2-11 | 30,378 | $ | 352,992 | Opt | 2-10 | 61,469 | $19.73 | $ | 288,449 | ||||||||||||||||||||||||||||||||||||||||||||||||||||||||||||||||||||||||||
| PSU | 2-10 | 13,324 | 26,648 | 39,972 | 454,881 | |||||||||||||||||||||||||||||||||||||||||||||||||||||||||||||||||||||||||||||||
| RSU | 2-10 | 25,342 | 499,998 | |||||||||||||||||||||||||||||||||||||||||||||||||||||||||||||||||||||||||||||||||
| Mr. Popwell | MIP | 2-11 | $250,000 | $ | 500,000 | $ | 750,000 | NA | MIP | 2-10 | $250,000 | $ | 500,000 | $ | 750,000 | NA | ||||||||||||||||||||||||||||||||||||||||||||||||||||||||||||||||||||
| Opt | 2-11 | 60,240 | $ | 11.62 | $ | 177,563 | Opt | 2-10 | 35,478 | $19.73 | $ | 166,484 | ||||||||||||||||||||||||||||||||||||||||||||||||||||||||||||||||||||||||
| PSU | 2-11 | 9,127 | 18,254 | 27,381 | 175,056 | PSU | 2-10 | 5,127 | 10,254 | 15,381 | 175,036 | |||||||||||||||||||||||||||||||||||||||||||||||||||||||||||||||||||||||||
| RSU | 2-11 | 30,120 | 349,994 | RSU | 2-10 | 17,739 | 349,990 | |||||||||||||||||||||||||||||||||||||||||||||||||||||||||||||||||||||||||||||
| Mr. Tuggle | MIP | 2-11 | $213,750 | $ | 427,500 | $ | 641,250 | NA | MIP | 2-10 | $213,750 | $ | 427,500 | $ | 641,250 | NA | ||||||||||||||||||||||||||||||||||||||||||||||||||||||||||||||||||||
| Opt | 2-11 | 44,965 | $ | 11.62 | $ | 132,539 | Opt | 2-10 | 26,482 | $19.73 | $ | 124,269 | ||||||||||||||||||||||||||||||||||||||||||||||||||||||||||||||||||||||||
| PSU | 2-11 | 6,813 | 13,625 | 20,438 | 130,664 | PSU | 2-10 | 3,827 | 7,653 | 11,480 | 130,637 | |||||||||||||||||||||||||||||||||||||||||||||||||||||||||||||||||||||||||
| RSU | 2-11 | 22,482 | 261,241 | RSU | 2-10 | 13,241 | 261,245 | |||||||||||||||||||||||||||||||||||||||||||||||||||||||||||||||||||||||||||||
Explanations of certain columns follow:
Col (b). An award is effective for legal and accounting purposes on its grant date. For each
award shown, the Compensation Committee took final action to grant each award on that date.
Cols (c)-(e) MIP Bonus Opportunities.The Committee established performance criteria and set target amounts early in 20162017 for MIP bonus opportunities. Details about the opportunities, their goals, and their limitations are discussed in “Annual MIP Bonus” beginning on page 49.55.
Mr. Kisber’s compensation package, including annual MIP bonus, is based on a percentage of net profits generated by the FTN Financial fixed income division, without any threshold or target levels. The Compensation Committee established an overall maximum of $6 million for Mr. Kisber’s 20162017 package, payable in this order if earned: first, $600,000 of salary; second, $2.5 million of MIP cash bonus; third, $1.9 million of regular annual stock awards (RSUs, PSUs, and options) to be granted in 2017;2018; and fourth, $1 million in cash-paid MIP-driven RSUs, also to be granted in 2017.2018. His entire MIP bonus opportunity was, therefore, $3.5 million. Correspondingly, all stock awards granted to Mr. Kisber in 2016,2017, whether or not connected to the MIP, relate back to FTN’sFTN Financial’s net profits in 2015.2016.
The information in columns (c)-(e) shows 20162017 MIP bonus opportunities. Information concerning MIP bonuses actually earned for 20162017 is shown in column (g) of the Summary Compensation Table and under the caption “Annual MIP Bonus” beginning on pages 5867 and 49,55, respectively.
Cols (f)-(h) Stock Incentives. The performance requirements for the 20162017 PSU awards are discussed in the notes for column (e) of the Summary Compensation Table above. Performance below the threshold level will result in 0% payout. Performance above threshold will result in payouts ranging from 50% (col (f)) to 100% (col (g)) to 150% (col (h)) of target levels. See “Performance Stock Units” beginning on page 5160 for additional information. The 20162017 PSUs will vest
on May 12, 20192020 if threshold performance is achieved, but payment will be deferred for two years.
Also included in these columns is Mr. Jordan’s special retention stock units. These have a performance goal based on total shareholder return for a seven-year performance period. If the performance goal and the seven-year service requirements are met, payout is 100%; if not, payout is zero. There are no lesser or greater payment levels for varying degrees of performance.
Col (i) Other Stock Awards. Column (i) includes RSUs granted in 2016.2017.
| 70 |
| RECENT COMPENSATION |
Cols (j)-(k) Stock Options.Column (j) shows the number of shares granted under options to the named executives in 2016,2017, and column (k) shows the exercise price per share of those options. The exercise price was the market price of our stock on the grant date. Mr. Jordan received two option grants, a regular annual award and a special retention award, which are shown in separate rows in the table. For additional information regarding option awards see the discussion of column (f) of the Summary Compensation Table beginning on page 5867 of this proxy statement.
Col (l) Grant date fair values.Column (l) reflects the accounting value of the awards shown in columns (g), (i) and (j). Our stock price on the grant date, February 11, 2016,10, 2017, was $11.62$19.73 per share. For stock options, the grant date fair value is based on the Black Scholes value on the grant date, which was $2.9476$4.6926 per share. For additional information see the discussion of columns (e) and (f) of the Summary Compensation Table beginning on page 58.67.
Supplemental Disclosures for Summary Compensation and Grant Tables
For information about the rationale behind, sizing of, and other aspects concerning the major compensation elements, see “Overview of Direct Compensation Components,” “Relative Sizing & Mix,” and “Salary” beginning on pages 43, 47,49, 53, and 49,55, respectively.
The vesting and expiration schedules of equity-based awards granted in 20162017 are as follows:
| • | Regular stock options vest in equal parts on March 2 of the first four years after grant and expire on March 2 seven years after grant. |
| • | PSUs vest on May 12 three years after grant if goals are achieved at the 50% payout level or greater. |
| • | RSUs vest on March 2 three |
Vesting information related to all equity awards held by the named executives at year-end appears under the heading “Outstanding Equity Awards at Fiscal Year-End” beginning on page 63,72, especially in the notes to the table in that section. For all awards, vesting will or may be accelerated or proratedpro-rated in the cases of death, disability, retirement, and qualifying termination after a change in control.
For performance awards, service-vesting may be
waived, but performance goals generally are not waived, following retirement, and awards may be pro-rated. Additional information concerning the acceleration features of awards is set forth under the caption “Change in Control (CIC) Arrangements” on page 69.78.
Dividends or dividend equivalents accrue at normal declared rates on stock awards other than options. Accrued dividends and equivalents are paid at vesting, or forfeit if the award is forfeited.
The Compensation Committee has approved a mandatory tax withholding feature under which
vested shares are automatically withheld in an amount necessary to cover minimum required withholding taxes. Starting in 2017, aA supplemental feature allows the holder to elect withholding at the maximum tax rate instead. Options have no mandatory or supplemental tax feature. Under our Equity Compensation Plan we do not re-use, in new grants, shares withheld to cover taxes.
The Compensation Committee generally has the power to impose deferral of payment as a term or condition of an award. The 20162017 PSUs have a . mandatory two-year payment deferral after vesting.
| 71 |
| RECENT COMPENSATION |
Outstanding Stock Awards at Fiscal Year-End
The following table provides information about stock options, all types of restricted stock and stock units, and all performance stock awards (at target levels) held at December 31, 20162017 by the named executive officers.
Outstanding Equity Awards at Fiscal Year-End 20162017
| (a) | (b) | (c) | (d) | (e) | (f) | (g) | (h) | (i) | (j) | (b) | (c) | (d) | (e) | (f) | (g) | (h) | (i) | (j) | ||||||||||||||||||||||||||||||||||||||||
| Option Awards | Stock Awards | Option Awards | Stock Awards | |||||||||||||||||||||||||||||||||||||||||||||||||||||||
| Name | Number of Securities Underlying Unexercised Options(#) Exercisable | Number of Securities Underlying Unexercised Options(#) Unexercisable | Equity Incentive Plan Awards: Number of Securities Underlying Unearned Options(#) | Option Exercise Price ($/sh) | Option Expiration Date | Number of Shares or Units of Stock Held that Have Not Vested(#) | Market Value of Shares or Units of Stock that Have Not Vested($) | Equity Incentive Plan Awards: Number of Unearned Shares, Units or Other Rights that Have Not Vested(#) | Equity Incentive Plan Awards: Market or Payout Value of Unearned Shares, Units or Other Rights that Have Not Vested($) | Number of Securities Underlying Unexercised Options(#) Exercisable | Number of Securities Underlying Unexercised Options(#) Unexercisable | Equity Incentive Plan Awards: Number of Securities Underlying Unearned Options(#) | Option Exercise Price ($/sh) | Option Expiration Date | Number of Shares or Units of Stock Held that Have Not Vested(#) | Market Value of Shares or Units of Stock that Have Not Vested($) | Equity Incentive Plan Awards: Number of Unearned Shares, Units or Other Rights that Have Not Vested(#) | Equity Incentive Plan Awards: Market or Payout Value of Unearned Shares, Units or Other Rights that Have Not Vested($) | ||||||||||||||||||||||||||||||||||||||||
| Mr. Jordan | 139,075 | 46,359 | — | $ | 10.82 | 2/12/2020 | 185,434 | — | — | $ | 10.82 | 2/12/2020 | ||||||||||||||||||||||||||||||||||||||||||||||
| 59,728 | 59,728 | — | 11.77 | 2/12/2021 | 89,592 | 29,864 | — | 11.77 | 2/12/2021 | |||||||||||||||||||||||||||||||||||||||||||||||||
| 26,720 | 80,160 | — | 14.28 | 3/2/2022 | 53,440 | 53,440 | — | 14.28 | 3/2/2022 | |||||||||||||||||||||||||||||||||||||||||||||||||
| — | 188,253 | — | 11.62 | 3/2/2023 | 47,063 | 141,190 | — | 11.62 | 3/2/2023 | |||||||||||||||||||||||||||||||||||||||||||||||||
| — | 411,747 | — | 11.62 | 3/2/2023 | — | 411,747 | — | 11.62 | 3/2/2023 | |||||||||||||||||||||||||||||||||||||||||||||||||
| 103,647 | $2,073,976 | 717,678 | $14,360,737 | — | 110,871 | 19.73 | 3/2/2024 | |||||||||||||||||||||||||||||||||||||||||||||||||||
| 101,500 | $ | 2,028,985 | 396,659 | $ | 7,929,213 | |||||||||||||||||||||||||||||||||||||||||||||||||||||
| Mr. Losch | 48,607 | — | — | $ | 11.85 | 2/11/2018 | 62,846 | — | — | 10.82 | 2/12/2020 | |||||||||||||||||||||||||||||||||||||||||||||||
| 47,134 | 15,712 | — | 10.82 | 2/12/2020 | 33,852 | 11,284 | — | 11.77 | 2/12/2021 | |||||||||||||||||||||||||||||||||||||||||||||||||
| 22,568 | 22,568 | — | 11.77 | 2/12/2021 | 20,832 | 20,834 | — | 14.28 | 3/2/2022 | |||||||||||||||||||||||||||||||||||||||||||||||||
| 10,416 | 31,250 | — | 14.28 | 3/2/2022 | 14,307 | 42,921 | — | 11.62 | 3/2/2023 | |||||||||||||||||||||||||||||||||||||||||||||||||
| — | 57,228 | — | 11.62 | 3/2/2023 | — | 33,705 | — | 19.73 | 3/2/2024 | |||||||||||||||||||||||||||||||||||||||||||||||||
| 83,078 | $1,662,391 | 40,952 | $ 819,450 | 77,363 | $ | 1,546,486 | 39,410 | $ | 787,806 | |||||||||||||||||||||||||||||||||||||||||||||||||
| Mr. Kisber | 10,025 | — | — | $ | 28.27 | 7/1/2017 | 7,846 | — | — | 36.09 | 7/1/2018 | |||||||||||||||||||||||||||||||||||||||||||||||
| 7,846 | — | — | 36.09 | 7/1/2018 | ||||||||||||||||||||||||||||||||||||||||||||||||||||||
| 10,312 | — | — | 27.46 | 7/1/2019 | 10,312 | — | — | 27.46 | 7/1/2019 | |||||||||||||||||||||||||||||||||||||||||||||||||
| 166,358 | 55,453 | — | 10.82 | 2/12/2020 | 221,811 | — | — | 10.82 | 2/12/2020 | |||||||||||||||||||||||||||||||||||||||||||||||||
| 57,774 | 57,774 | — | 11.77 | 2/12/2021 | 86,661 | 28,887 | — | 11.77 | 2/12/2021 | |||||||||||||||||||||||||||||||||||||||||||||||||
| 8,513 | — | — | 23.49 | 7/2/2021 | 8,513 | — | — | 23.49 | 7/2/2021 | |||||||||||||||||||||||||||||||||||||||||||||||||
| 3,156 | — | — | 15.84 | 7/1/2022 | 3,156 | — | — | 15.84 | 7/1/2022 | |||||||||||||||||||||||||||||||||||||||||||||||||
| 30,378 | $ 607,864 | 43,330 | $ 867,033 | — | 61,469 | — | 19.73 | 3/2/2024 | ||||||||||||||||||||||||||||||||||||||||||||||||||
| 55,720 | $ | 1,113,843 | 26,648 | $ | 532,694 | |||||||||||||||||||||||||||||||||||||||||||||||||||||
| Mr. Popwell | 49,907 | 16,636 | — | $ | 10.82 | 2/12/2020 | 66,543 | — | — | $ | 10.82 | 2/12/2020 | ||||||||||||||||||||||||||||||||||||||||||||||
| 23,896 | 23,896 | — | 11.77 | 2/12/2021 | 35,842 | 11,948 | — | 11.77 | 2/12/2021 | |||||||||||||||||||||||||||||||||||||||||||||||||
| 11,029 | 33,088 | — | 14.28 | 3/2/2022 | 22,058 | 22,059 | — | 14.28 | 3/2/2022 | |||||||||||||||||||||||||||||||||||||||||||||||||
| — | 60,240 | — | 11.62 | 3/2/2023 | 15,060 | 45,180 | — | 11.62 | 3/2/2023 | |||||||||||||||||||||||||||||||||||||||||||||||||
| 90,078 | $1,802,461 | 43,253 | $ 865,493 | — | 35,478 | — | 19.73 | 3/2/2024 | ||||||||||||||||||||||||||||||||||||||||||||||||||
| 83,922 | $ | 1,677,601 | 41,560 | $ | 830,784 | |||||||||||||||||||||||||||||||||||||||||||||||||||||
| Mr. Tuggle | 39,510 | 13,170 | — | $ | 10.82 | 2/12/2020 | 52,680 | — | — | $ | 10.82 | 2/12/2020 | ||||||||||||||||||||||||||||||||||||||||||||||
| 19,169 | 19,170 | — | 11.77 | 2/12/2021 | 28,754 | 9,585 | — | 11.77 | 2/12/2021 | |||||||||||||||||||||||||||||||||||||||||||||||||
| 9,147 | 27,442 | — | 14.28 | 3/2/2022 | 18,294 | 18,295 | — | 14.28 | 3/2/2022 | |||||||||||||||||||||||||||||||||||||||||||||||||
| — | 44,965 | — | 11.62 | 3/2/2023 | 11,241 | 33,724 | — | 11.62 | 3/2/2023 | |||||||||||||||||||||||||||||||||||||||||||||||||
| 59,945 | $1,199,499 | 34,033 | $ 681,000 | — | 26,482 | — | 19.73 | 3/2/2024 | ||||||||||||||||||||||||||||||||||||||||||||||||||
| 54,017 | $ | 1,079,800 | 32,103 | $ | 641,739 | |||||||||||||||||||||||||||||||||||||||||||||||||||||
| 72 |
| RECENT COMPENSATION |
Explanations of certain columns in the table follow:
Col (c) Unvested Options. The vesting dates of options reported in column (c) are:
Stock Options Unvested at Year-End 2017
| Grant | Vesting | |||||||||||||||||||||||||||||||||
| Date | Date | Mr. Jordan | Mr. Losch | Mr. Kisber | Mr. Popwell | Mr. Tuggle | ||||||||||||||||||||||||||||
| 2/12/2013 | 2/12/2017 | 46,359 | 15,712 | 55,453 | 16,636 | 13,170 | ||||||||||||||||||||||||||||
| Grant Date | Vesting Date | Mr. Jordan | Mr. Losch | Mr. Kisber | Mr. Popwell | Mr. Tuggle | ||||||||||||||||||||||||||||
| 2/12/2014 | 2/12/2017 | 29,864 | 11,284 | 28,887 | 11,948 | 9,585 | 2/12/2018 | 29,864 | 11,284 | 28,887 | 11,948 | 9,585 | ||||||||||||||||||||||
| 2/12/2018 | 29,864 | 11,284 | 28,887 | 11,948 | 9,585 | |||||||||||||||||||||||||||||
| 2/12/2015 | 3/2/2017 | 26,720 | 10,416 | — | 11,029 | 9,147 | 3/2/2018 | 26,720 | 10,417 | — | 11,029 | 9,147 | ||||||||||||||||||||||
| 3/2/2018 | 26,720 | 10,417 | — | 11,029 | 9,147 | |||||||||||||||||||||||||||||
| 3/2/2019 | 26,720 | 10,417 | — | 11,030 | 9,148 | 3/2/2019 | 26,720 | 10,417 | — | 11,030 | 9,148 | |||||||||||||||||||||||
| 2/11/2016 | 3/2/2017 | 47,063 | 14,307 | — | 15,060 | 11,241 | 3/2/2018 | 47,063 | 14,307 | — | 15,060 | 11,241 | ||||||||||||||||||||||
| (regular) | 3/2/2018 | 47,063 | 14,307 | — | 15,060 | 11,241 | 3/2/2019 | 47,063 | 14,307 | — | 15,060 | 11,241 | ||||||||||||||||||||||
| 3/2/2019 | 47,063 | 14,307 | — | 15,060 | 11,241 | 3/2/2020 | 47,064 | 14,307 | — | 15,060 | 11,242 | |||||||||||||||||||||||
| 3/2/2020 | 47,064 | 14,307 | — | 15,060 | 11,242 | |||||||||||||||||||||||||||||
| 2/11/2016 | 3/2/2020 | 137,249 | — | — | — | — | 3/2/2020 | 137,249 | — | — | — | — | ||||||||||||||||||||||
| (retention) | 3/2/2021 | 137,249 | — | — | — | — | 3/2/2021 | 137,249 | — | — | — | — | ||||||||||||||||||||||
| 3/2/2022 | 137,249 | — | — | — | — | 3/2/2022 | 137,249 | — | — | — | — | |||||||||||||||||||||||
| 2/10/2017 | 3/2/2018 | 27,717 | 8,426 | 15,367 | 8,869 | 6,620 | ||||||||||||||||||||||||||||
| 3/2/2019 | 27,718 | 8,426 | 15,367 | 8,869 | 6,620 | |||||||||||||||||||||||||||||
| 3/2/2020 | 27,718 | 8,426 | 15,367 | 8,870 | 6,621 | |||||||||||||||||||||||||||||
| 3/2/2021 | 27,718 | 8,427 | 15,368 | 8,870 | 6,621 | |||||||||||||||||||||||||||||
Col (g) Unvested Non-Performance Shares & Units.Column (g) includes unvested RSUs and RS, specifically regular annual RSUs and special retention RS awards. The vesting dates of those awards are shown below:in the following table:
RS & RSU Awards Unvested at Year-End 2017
| Grant | Award | Vesting | Award | Vesting | ||||||||||||||||||||||||||||||||||
| Date | Type | Date | Mr. Jordan | Mr. Losch | Mr. Kisber | Mr. Popwell* | Mr. Tuggle | Type | Date | Mr. Jordan | Mr. Losch | Mr. Kisber | Mr. Popwell | Mr. Tuggle | ||||||||||||||||||||||||
| 2/12/2014 | RSU | 2/12/2017 | — | — | — | 23,895 | — | |||||||||||||||||||||||||||||||
| 2/12/2014 | RSU | 3/2/2017 | 29,864 | 22,567 | — | — | 19,169 | |||||||||||||||||||||||||||||||
| 2/12/2015 | RSU | 3/2/2018 | 26,720 | 20,833 | — | 22,058 | 18,294 | RSU | 3/2/2018 | 26,720 | 20,833 | — | 22,058 | 18,294 | ||||||||||||||||||||||||
| 2/12/2015 | Ret RS | 3/2/2020 | — | 11,064 | — | 14,005 | — | Ret RS | 3/2/2020 | — | 11,064 | — | 14,005 | — | ||||||||||||||||||||||||
| 2/11/2016 | RSU | 3/2/2019 | 47,063 | 28,614 | 30,378 | 30,120 | 22,482 | RSU | 3/2/2019 | 47,063 | 28,614 | 30,378 | 30,120 | 22,482 | ||||||||||||||||||||||||
| * Mr. Popwell’s 2014 award vests on February 12 rather than March 2. | ||||||||||||||||||||||||||||||||||||||
| 2/10/2017 | RSU | 3/2/2020 | 27,717 | 16,852 | 25,342 | 17,739 | 13,241 | |||||||||||||||||||||||||||||||
Col (i) Performance Equity Awards. Column (i) reports PSU awards, and a special retention stock unit award, granted from 20122015 through 20162017 which are outstanding at year-end. The performance periods for those awards are shown below. The performance period for the 20142015 PSU awards has ended, but performance (relative to peers) cannot be determined until all peer companies have reported 20162017 earnings.
Awards are reported in units at target levels. In eachall but one case, except two, the maximum is 150% of target.
For the special retention awardsaward in 2012 and 2016, the maximum is 100%. Those two areThat is a special
incentive/retention awardsaward for the CEO. The 2012 award pays nothing unless either (a) our stock maintains a $20 price level for a certain period before the 5th anniversary of grant, or (b) the value of a share of our stock on the 5th anniversary, measured using total shareholder return from the grant date, is at least $20. The 2016 awardIt pays if the total shareholder return value of a share of stock is at least $11.63 on the 7thseventh anniversary of grant. EachThe special award also requires continuous employment with the company forduring the performance period.
| 73 |
| RECENT COMPENSATION |
Performance Equity Awards Unvested at Year-End 2017
(Stock Units at Target Level)
| Grant | Performance | |||||||||||||||||||||
| Date | Period | Mr. Jordan | Mr. Losch | Mr. Kisber | Mr. Popwell | Mr. Tuggle | ||||||||||||||||
| 5/07/2012* | 5/12-5/17 | 325,379 | — | — | — | — | ||||||||||||||||
| 2/12/2014 | 2014-16 | 59,727 | 11,283 | 43,330 | 11,947 | 9,583 | ||||||||||||||||
| 2/12/2015 | 2015-17 | 63,242 | 12,327 | — | 13,052 | 10,825 | ||||||||||||||||
| 2/11/2016 | 2016-18 | 114,092 | 17,342 | — | 18,254 | 13,625 | ||||||||||||||||
| 2/11/2016* | 2/16-2/23 | 155,238 | — | — | — | — | ||||||||||||||||
| * Special retention awards in 2012 and 2016 pay all-or-none rather than on a scale. | ||||||||||||||||||||||
| Grant | Performance | |||||||||||
| Date | Period | Mr. Jordan | Mr. Losch | Mr. Kisber | Mr. Popwell | Mr. Tuggle | ||||||
| 2/12/2015 | 2015-17 | 63,242 | 12,327 | — | 13,052 | 10,825 | ||||||
| 2/11/2016 | 2016-18 | 114,092 | 17,342 | — | 18,254 | 13,625 | ||||||
| 2/11/2016* | 2/2016-2/2023 | 155,238 | — | — | — | — | ||||||
| 2/10/2017 | 2017-19 | 64,087 | 9,741 | 26,648 | 10,254 | 7,653 |
| * Special CEO retention award in 2016 pays all-or-none rather than on a scale. |
Cols (h) & (j) Values. Columns (h) and (j) reflect year-end market values ($20.01/19.99/share) of the awards reported in columns (g) and (i),
respectively, with no discount for risk of forfeiture or time delay until vesting. The values reported are not based on financial accounting methods.
Options Exercised and Stock Vested
The following table shows stock options exercised by the named officers along with other stock awards that vested during 2016.2017. The stock awards shown consist of regular RSUs and PSUs granted in 2013
and RS awards granted as part2014, all of 2012 bonus. The PSUswhich were paid in shares of stock. The dollar
values realizedshown for the stock awards are based on market prices of our stock on the respective vesting dates.dates plus accrued cash dividend equivalents, before withholding taxes.
Options Exercised and Stock Awards Vested During 2016
| Options Exercised and Stock Awards Vested During 2017 | Options Exercised and Stock Awards Vested During 2017 | |||||||||||||||||||||||
| (a) | (b) | (c) | (d) | (e) | (b) | (c) | (d) | (e) | ||||||||||||||||
| | Option Awards | Stock Awards | ||||||||||||||||||||||
| Option Awards | Stock Awards | |||||||||||||||||||||||
| Name | Number of Shares Acquired on Exercise(#) | Value Realized on Exercise($) | Number of Shares Acquired or Units Paid on Vesting(#) | Value Realized on Vesting($) | Number of Shares Acquired on Exercise(#) | Value Realized on Exercise($) | Number of Shares Acquired or Units Paid on Vesting(#) | Value Realized on Vesting($) | ||||||||||||||||
| Mr. Jordan | 483,306 | $2,277,264 | 79,207 | $1,078,575 | — | — | 97,057 | $1,786,074 | ||||||||||||||||
| Mr. Losch | 84,566 | 480,335 | 26,104 | 356,023 | 48,607 | $328,941 | 35,260 | 678,277 | ||||||||||||||||
| Mr. Kisber | 456,230 | 2,190,161 | 79,710 | 1,096,810 | — | — | 48,746 | 859,392 | ||||||||||||||||
| Mr. Popwell | 110,422 | 523,686 | 28,154 | 395,634 | — | — | 37,336 | 731,457 | ||||||||||||||||
| Mr. Tuggle | 142,220 | 670,017 | 23,111 | 314,245 | — | — | 29,950 | 576,133 | ||||||||||||||||
| 74 |
| POST-EMPLOYMENT COMPENSATION |
We offer programs providing benefits after retirement and for certain other terminations. Other programs have features that enhance, accelerate, reduce, shorten, or forfeit benefits if employment terminates in various ways. Those programs and features are discussed in this section.
Common post-employment terms include:
| • | Discharge or Resignation. A termination of employment by First Horizon or by the executive, respectively, other than disability or retirement. |
| • | Disability. A permanent inability to work. |
| • | Retirement. A termination of employment after meeting certain age and service requirements specified in the applicable program. Some programs specify early and normal retirement requirements; others specify only normal retirement or make no provision for retirement. |
| • | Change in Control, or |
We operate two defined benefit retirement plans: a broad-based tax-qualified pension plan and an unfunded non-qualified pension restoration plan limited to employees for whom the qualified benefit is limited by tax law. The restoration plan extends the benefit beyond that tax law limit. The two plans effectively provide a single pension benefit.
The plans were closed to new hires in 2007, and benefits were frozen at year-end 2012. Credited service years do not increase after 2012, and changes in compensation are ignored.
Pension benefits are based on average compensation for the highest 60 consecutive months of the last 120 months of service prior to 2013, length of service prior to 2013, and social security benefits. Covered compensation includes cash salary reportable to the IRS plus pre-tax contributions under the savings plan and employee contributions under the flexible benefits plan, and excludes bonuses, commissions, other deferred compensation, and incentives.
A “normal” pension benefit provides a monthly payment to the employee for life beginning at retirement at age 65. Participants under age 65 who are at least age 55 with 15 years of service may retire early with a reduced pension benefit. The reduction varies based on age at retirement. Similarly, a delay in retirement will increase benefits. A participant may make other elections which change the benefit. Those include a spousal benefit election, a minimum (certain) payment term, and a lump sum benefit (restoration plan only). Married participants often choose a qualified
joint and survivor annuity with a surviving spouse receiving 50 percent of the participant’s benefit.
The following table shows estimated normal retirement benefits under the pension plans as of December 31, 2016.2017. Mr. Losch does not participate in these plans.
Pension Benefits at Year-End 2017
| (a) | (b) | (c) | (d) | (e) | |||||||
| Number of | Present | ||||||||||
| Years of | Value of | Payments | |||||||||
| Credited | Accumulated | During Last | |||||||||
| Name | Plan | Service (#) | Benefit ($) | Fiscal Year ($) | |||||||
| Mr. Jordan | Qualified | 6 yrs | $286,332 | — | |||||||
| Restoration | 6 yrs | — | |||||||||
| Mr. Kisber | Qualified | 20 yrs | $947,911 | — | |||||||
| Restoration | NA | NA | NA | ||||||||
| Mr. Popwell | Qualified | 6 yrs | $306,726 | — | |||||||
| Restoration | 6 yrs | — | |||||||||
| Mr. Tuggle | Qualified | 9 yrs | $580,141 | — | |||||||
| Restoration | 9 yrs | 980,820 | — |
Explanations of certain columns follow:
Col (c). This column shows full years of credited service, unchanged since 2012.
Col (d). Column (d) reflects the actuarial present value of each named executive’s accumulated benefit, computed as of the same pension plan measurement date used for financial statement reporting purposes with respect to 20162017 except that retirement age is assumed to be the normal retirement age of 65. Column (d) amounts were calculated by the pension plan actuary using the projected unit credit cost method. This method
| 75 |
| POST-EMPLOYMENT COMPENSATION |
recognizes cost in an increasing pattern as a participant approaches retirement. The 20162017 discount rates are 4.39%3.76% for the pension plan and 4.07%3.59% for the pension restoration plan and reflect the expected average term until settlement of each of these plans. The assumptions on which the
amounts presented in the table are based are discussed in note 18 to our financial statements.
Col (e). No pension benefit amounts were paid during 20162017 to any named executive officer.
Non-Qualified Deferred Compensation Plans
We provide several plans allowing executives to defer receipt and taxation of cash salary and bonus. Deferred amounts are credited to accounts and earnings accrue according to the provisions of each plan. Participants have some discretion regarding the length of the deferral period, the investment criteria upon which earnings are based, and whether payout will be lump sum or an annuity. A commonly selected deferral period lasts until employment terminates. These plans are unfunded: no trust holds funds in the accounts, which legally are unsecured debt we owe participants.
In all plans each account is fully vested and non-forfeitable. Except for the timing of payments, plan accounts are not reduced or enhanced by termination of employment, change in control, or other event.
The qualified plan allows an employee to make contributions of salary into a plan account, subject to limits imposed by tax laws. We provide a 100% match under the broad-based tax-qualified savings plan for the first 6% of salary each eligible
participant (having at least one year of service) elects to defer into the plan.
We have adopted a savings restoration plan for those employees, including most executives, whose base salary exceeds the tax limits imposed on the qualified plan. The restoration plan provides a nonqualified vehicle for highly-paid employees to continue to participate in a savings plan beyond the tax law limits. Unlike the qualified plan, the restoration plan is unfunded. The restoration plan offers many of the same investment options as the qualified plan, but our stock is not among those.
We reduce the risk of our obligations under the restoration and other nonqualified deferred compensation plans by purchasing investments designed to track the performance of the investment elections made by participants.
Information concerning account activities and balances of the named executive officers with respect to non-qualified deferred compensation plans is presented below.
Nonqualified Deferred Compensation During and at Year-End 2017
| (a) | (b) | (c) | (d) | (e) | (f) | (b) | (c) | (d) | (e) | (f) | ||||||||||||||||||||||||||||||
| Executive | Company | Aggregate | Aggregate | |||||||||||||||||||||||||||||||||||||
| Contributions in | Contributions in | Earnings in | Aggregate | Balance at Last | ||||||||||||||||||||||||||||||||||||
| Last Fiscal | Last Fiscal | Last | Withdrawals/ | Fiscal Year | ||||||||||||||||||||||||||||||||||||
| Name | Executive Contributions in Last Fiscal Year ($) | Company Contributions in Last Fiscal Year ($) | Aggregate Earnings in Last Fiscal Year ($) | Aggregate Withdrawals/ Distributions ($) | Aggregate Balance at Last Fiscal Year End ($) | Year ($) | Year ($) | Fiscal Year ($) | Distributions ($) | End ($) | ||||||||||||||||||||||||||||||
| Mr. Jordan | $324,969 | $36,959 | $147,991 | — | $1,810,094 | $403,350 | $36,300 | $346,262 | — | $2,559,705 | ||||||||||||||||||||||||||||||
| Mr. Losch | 12,219 | 12,992 | 7,912 | — | 122,157 | 24,600 | 12,300 | 22,748 | — | 169,505 | ||||||||||||||||||||||||||||||
| Mr. Kisber | 20,100 | 20,815 | 200,960 | — | 1,254,793 | 39,600 | 19,800 | 70,309 | — | 1,383,381 | ||||||||||||||||||||||||||||||
| Mr. Popwell | 13,719 | 14,435 | 9,458 | — | 135,136 | 27,600 | 13,800 | 19,919 | — | 182,655 | ||||||||||||||||||||||||||||||
| Mr. Tuggle | 12,600 | 13,142 | 32,683 | — | 457,634 | 24,600 | 12,300 | 82,307 | — | 564,541 | ||||||||||||||||||||||||||||||
Explanations of certain columns follow:
Col (b).Traditional deferred compensation plan.plan. Currently up to 80% of cash salary and 80% of annual cash bonus may be deferred in the traditional deferred compensation plan for executives.
Col (b).Savings restoration plan.plan. Column (b) includes executive salary contributions to this plan.
Col (c). Includes company matching contributions under the savings restoration plan. We make no company contributions to the traditional deferred compensation plan.
Col (d). Earnings reflect interest for those accounts that earn interest. For accounts that are phantom shares of stock or mutual funds, earnings reflect increases and decreases of account value throughout the year. Those amounts are netted as applicable to the individual.
| 76 |
| POST-EMPLOYMENT COMPENSATION |
Col (e). Hardship withdrawals are allowed under certain plans. Except under the savings restoration plan, an in-service distribution date may be selected when the deferral election is made.
Col (f). Certain plan accounts are denominated as numbers of shares of stock or mutual funds. All
such accounts are valued based on the fair market value of those shares at year-end.
The information above excludes the tax-qualified savings plan. For additional information concerning deferred compensation plans see “Deferral, Retirement, and Other Benefits” beginning on page 53.63.
Employment & Termination Arrangements
We have no employment agreement with any named executive. Many plans and programs contain special provisions regarding termination of employment in various common situations, including in connection with retirement or a change
in control. We also have certain other arrangements that deal primarily with retirement and change in control situations. This section provides information concerning those provisions and arrangements.
Termination Unrelated to Change in Control
The table below summarizes the impact upon the amounts of various items of compensation of a termination of employment under certain circumstances, other than termination related to a change in control event. Change in control
situations are discussed in the following section. In addition to forfeiture of unpaid benefits, many awards provide for clawback of paid benefits if discharge “for cause,” as defined in the applicable program, occurs within two years of payment.
Impact of Termination Events on Unpaid Compensation Items
| Resignation/Discharge | Death/Disability | Retirement | Key Facts | |||||
| MIP Bonus Opportunity | Forfeit | Generally forfeit, but discretionary payment is possible | Generally forfeit, but discretionary payment is possible | Committee can pro-rate or fully waive service requirement, still subject to performance conditions | ||||
| PSUs | Forfeit | Pro-rated waiver of service requirement, no waiver of performance | For approved retirement, pro-rated waiver of service requirement, no waiver of performance | Committee may require covenants such as | ||||
| Exercisable Stock Options | Expire 3 months after termination | Expire 3 years after termination | Expire 3 years after termination | Option term is shortened to new expiration date, cannot be extended | ||||
| Unexercisable Stock Options | Forfeit | Expire 3 years after termination | Expire 3 years after termination | Option term is shortened to new expiration date, cannot be extended | ||||
| Restricted | Forfeit | Pro-rated | Discretionary payment is possible, usually pro-rated if approved | Committee may accelerate vesting in normal retirement situations subject to compliance with covenants such as non-competes | ||||
| Pension Plans, | No impact | No impact | No impact | Contributions, accounts, and benefits are fully vested | ||||
| Savings Restoration Plan | Lump sum payment | Lump sum payment | Lump sum payment | Benefits are fully vested; any termination triggers payment |
| 77 |
| POST-EMPLOYMENT COMPENSATION |
Change in Control (CIC) Arrangements
Special change in control (CIC) severance agreements are in place with each named executive officer except Mr. Kisber.officer. In addition, many of our compensation programs have special provisions that apply if we experience a CIC event. This section provides information concerning arrangements and benefits that would apply if a CIC occurs.
CIC Definition
In our plans and programs the term “change in control” includes the following events:
| • | A majority of the members of our Board of Directors changes, with certain exceptions. |
| • | A person or other entity becomes the beneficial owner of 20 percent or more of our outstanding voting stock, with certain exceptions. |
| • | Our shareholders approve, and there is a consummation of, a merger or other business combination, unless (i) more than 50% (60% in the CIC severance agreements) of the voting power resulting from the business combination is |
| represented by voting securities outstanding |
| immediately prior thereto, (ii) no person or other entity beneficially owns 20% or more of the resulting corporation, and (iii) at least a majority (a two-thirds majority in the CIC severance agreements) of the members of the board of directors of the resulting corporation were our directors at the time of board approval of the transaction. | |
| • | Our shareholders’ approve a plan of complete liquidation or dissolution or a sale of substantially all of our assets. In 2016, two major plans—the Equity Compensation Plan and the Management Incentive Plan—were amended so that consummation of an asset sale, rather than mere approval, is a CIC event. |
Summary of CIC Effects
The following table summarizes the impacts of a CIC event on various items of compensation. Details about current dollar amounts of many of these items are provided in the “CIC Potential Payout” section below.
Impact of CIC on Unpaid Compensation Items
| Item | Impact | Key Factors | ||
| MIP | Pro-rate target amount of bonus if employment terminates | Performance at target is presumed; | ||
| PSUs | Award is paid at target if employment terminates; award may be adjusted, or converted to non-performance RSUs, if employment continues. | Committee has discretion to adjust or convert awards depending on the CIC context | ||
| Exercisable | No impact | |||
| Restricted | Accelerate if employment terminates, otherwise no impact | Awards have a double-trigger feature | ||
| Qualified | Limited impact | Any excess funding is allocated to all plan participants | ||
| Pension | Lump sum payment | See details below | ||
| Qualified | No impact | |||
| Savings | No impact from CIC | Any separation results in lump sum payment; CIC itself has no effect on amount or timing of payment | ||
| NQ | Limited impact | Accounts are paid into rabbi trusts, inaccessible to FHN’s successor | ||
| CIC | Cash payment & other benefits if employment terminates | CIC benefits are discussed in the next section |
Under the pension restoration plan, a lump sum payment is made to participants representing the present value, using a discount rate of 4.2% of the participant’s scheduled projected benefits
actuarially adjusted based on the participant’s age
at the time of the CIC event. For participants under age 55, the CIC calculation is made assuming age 55 hashad been reached.
| 78 |
| POST-EMPLOYMENT COMPENSATION |
CIC Severance Agreements
We have CIC severance agreements with all of the named executives except Mr. Kisber.executives. The agreements provide a payment equal to three times annual base salary plus three times a “bonus amount” if we discharge the officer other than for disability, retirement, or cause, or if the officer resigns for a predefined good reason, in either case within 36 months after a CIC event. The “bonus amount” is the average actual annual cash bonus paid over the preceding five years, excluding the years with the highest and lowest bonuses. Older agreements (Messrs. Jordan and Tuggle) provide generally for a federal excise tax gross-up; newer agreements (Messrs. Losch, Kisber, and Popwell) have no such provision. Severance payments are to be reduced if a small reduction in benefit (up to 5% or $50,000) would avoid the excise tax. The agreements provide for continued healthcare and life insurance benefits for an 18-month period as allowed by tax laws. Non-disparagement, cooperation, and non-solicitation covenants are included in the agreements. These agreements do not guarantee employment for any term or period; they only apply if loss of employment occurs following a CIC event. Each
agreement can be
terminated unilaterally upon three years’ prior notice.
CIC Potential Payout
The table below shows potential amounts payable to the named executive officers if a CIC occurred and employment with us terminated on December 31, 2016.2017. The closing stock price on December 30, 201631, 2017 of $20.01$19.99 per share is used when valuing stock based items. For purposes of the table, the following assumptions and adjustments have been made: (1) the present value of future health and welfare and other non-cash benefits is calculated by using current costs; (2) the value of non-forfeited stock options is based solely on the spread between the option price and our actual year-end stock value; and (3) no forfeiture factors exist. Many of the amounts shown in the table accelerate the timing of payment of an amount that would have been paid eventually without increasing the amount paid. Except as noted, theThe table shows all payment amounts, affectedwhether or not increased by the CIC and termination, whether or not increased by the CIC, for the sake of completeness.
Potential Dollar Value of Payments Upon An Assumed
Termination of Employment at Year-End 20162017 Related to a CIC Event
| Cash | Pro Rata | Stock | Pension | Savings | Health & | Tax Gross-up | ||||||||||||||||||||||||||||||
| Name | Severance | Bonus* | Awards | Restoration** | Restoration | Welfare | Other | Payments*** | Total | |||||||||||||||||||||||||||
| Mr. Jordan | $ | 5,393,400 | $ | 922,800 | $ | 23,355,216 | $ | 689,527 | $ | 310,830 | $ | 27,981 | $ | 25,000 | $ | 13,124,141 | $ | 43,848,895 | ||||||||||||||||||
| Mr. Losch | 2,326,250 | 300,417 | 3,531,635 | NA | 122,157 | 22,865 | 25,000 | NA | 6,328,324 | |||||||||||||||||||||||||||
| Mr. Kisber | NA | 3,500,000 | 2,495,112 | NA | 326,695 | NA | NA | NA | 6,321,807 | |||||||||||||||||||||||||||
| Mr. Popwell | 2,567,500 | 355,833 | 3,777,640 | 329,535 | 135,136 | 23,445 | 25,000 | NA | 7,214,089 | |||||||||||||||||||||||||||
| Mr. Tuggle | 2,420,500 | 331,833 | 2,739,944 | NA | 151,548 | 23,060 | 25,000 | NA | 5,691,885 | |||||||||||||||||||||||||||
| Cash | Pro Rata | Stock | Pension | Savings | Health & | Tax Gross-up | ||||||||||||||||||||||||||||||
| Name | Severance | Bonus* | Awards | Restoration** | Restoration | Welfare | Other | Payments*** | Total | |||||||||||||||||||||||||||
| Mr. Jordan | $ | 5,684,400 | $ | 1,019,800 | $ | 15,480,439 | $ | 765,986 | $ | 394,586 | $ | 28,988 | $ | 25,000 | $ | 7,551,833 | $ | 30,951,032 | ||||||||||||||||||
| Mr. Losch | 2,491,250 | 355,417 | 2,991,924 | NA | 169,505 | 24,066 | 25,000 | NA | 6,057,162 | |||||||||||||||||||||||||||
| Mr. Kisber | 8,424,000 | 2,208,000 | 1,938,127 | NA | 436,604 | 26,987 | 25,000 | NA | 13,058,718 | |||||||||||||||||||||||||||
| Mr. Popwell | 2,687,500 | 395,833 | 3,204,193 | 362,440 | 182,655 | 24,647 | 25,000 | NA | 6,882,268 | |||||||||||||||||||||||||||
| Mr. Tuggle | 2,548,000 | 374,333 | 2,250,201 | NA | 209,414 | 24,066 | 25,000 | NA | 5,431,014 | |||||||||||||||||||||||||||
| * | ||
| ** | Absent a CIC event, a participant in the pension restoration plan can elect, at termination of employment, to receive a lump sum payment based on the present actuarial value of the expected pension payment stream. In a CIC context, participants will receive a lump sum payment in lieu of the payment stream. If a participant terminated in relation to a CIC is under age 55 or has less than 15 years of service, the CIC lump-sum payment would be enhanced to reflect that age and those service years. The amounts in the Pension Restoration column of the table for Messrs. Jordan and Popwell reflect an estimate of that enhancement measured at year-end. Due to his age and length of service, Mr. Tuggle would receive no such | |
| *** | Messrs. Jordan and Tuggle have the right to receive an excise tax gross-up payment, an estimate of which is included in the table. Based on the assumptions of his hypothetical termination at year-end, Mr. Tuggle’s estimated gross-up amount would be zero. For Messrs. Losch, Kisber, and Popwell, who have agreements after 2008, no gross-up would be paid. |
| 79 |
| DIRECTOR COMPENSATION |
Non-Employee Director Compensation ProgramsDirectors in 2017
Mr. Jordan serves onAt year-end 2017 and currently, we have twelve directors:
| John C. Compton | Vicki R. Palmer | |
| Mark A. Emkes | Colin V. Reed | |
| Peter M. Foss | Cecelia D. Stewart | |
| Corydon J. Gilchrist | Rajesh Subramaniam | |
| D. Bryan Jordan (Chairman) | R. Eugene Taylor (Vice Chairman) | |
| Scott M. Niswonger | Luke Yancy III |
Messrs. Foss and Taylor joined the Board on November 30 after consummation of our merger with Capital Bank Financial Corp.
In addition, R. Brad Martin served during most of 2017. Mr. Martin retired in December after 23 years of service. Compensation paid to Mr. Martin in 2017 is included in the following disclosures.
Messrs. Jordan and Taylor serve on our Board but, isbecause they are also employees, they are not paid for thatBoard service. No director program discussed in this “Director Compensation” section applies to him.either of them. No other director is an employee of ours. For information concerning Mr. Jordan, see “Compensation Discussion & Analysis,” “Recent Compensation,” and “Post-Employment Compensation” beginning on pages 43, 66, and 75, respectively. Information concerning Mr. Taylor is provided in this section.
Non-Employee Director Compensation Programs
DirectorNon-employee director compensation falls into two categories: base retainer and additional retainers. For each director the base retainer is $130,000, paid half in cash and half in RSUs. Additional retainers are paid in cash for particular assignments, such as Lead Directorlead director or Audit Committee chair. Audit Committee members who also serve on the Trust Audit Committee of the Bank are not separately compensated for Trust Audit service. The pay year for our directors starts April 1 and ends March 31, roughly synchronous with our annual meeting.
Director pay is summarized in this table:
Director Compensation 2016-172017-18
| Item | Annual Amt | |
| Base Retainer – cash portion: | $65,000 | |
| Base Retainer – RSU portion: | 65,000 | |
| Additional Retainers (all cash): | ||
| Lead | ||
| Chairman – Audit | 32,000 | |
| Chairman – Executive & Risk | 28,000 | |
| Chairman – Compensation | 17,500 | |
| Chairman – other committees | 10,000 | |
| Non-chair service – Audit | 8,000 | |
| Non-chair service – Exec & Risk | 8,000 |
RSUs are granted under our Equity Compensation Plan following election at the annual meeting.
RSUs vest in the year following grant, accrue dividends while unvested, and are paid in stock. Payment is required to be deferred for two years after vesting; the dollar value at grant is discounted to reflect that deferral. Grants are pro-rated for anyone elected to the Board after the annual meeting.meeting, such as Mr. Foss.
Other Non-Employee Director Programs
DirectorsNon-employee directors may serve as members of our Bank’s regional boards and may be paid, as additional Board compensation, cash attendance fees up to $500 per regional board meeting. In addition, directors may receive the following benefits: a personal account executive, a no fee personal checking account for the director and his or her spouse, a debit card, a no-fee VISA card, no fee
for a safe deposit box, no fee for traveler’s checks and cashier’s checks, use of tickets for marketing and other business events up to $5,000 in value, and, subject to certain restrictions and limitations, the repurchase of shares of our common stock under a Board-approved repurchase program with no payment of any fees or commissions. Directors may participate in a charitable gift matching program up to $25,000 per year.
Many directors have nonqualified deferred compensation accounts that earn interest or returns indexed to the performance of certain mutual funds selected by the director.
| 80 |
| DIRECTOR COMPENSATION |
Prior to 2006, directors could receive stock options in lieu of fees under certain deferral plans, some of which remain outstanding.
From 1985 to 1995, directors could defer fees and receive an accrual of interest at rates ranging from 17-22 percent annually. Although new deferrals under that old plan have not been permitted since 1995, interest continues to accrue on outstanding accounts. The rate is re-set annually. For many years, the rate has been set at 7 percentage points above a benchmark rate. For the 20162017 plan year, the interest rate was 10.16%9.28% for all active participants including two current directors, Ms. Palmer and Mr. Martin.Martin (who has since retired as a director). For 2017,2018, the rate has decreasedincreased to 9.28%10.12%, corresponding to an decreaseincrease in the benchmark rate. The plan continues to provide a retention tool for us since the above-market rates of return arecan be largely forfeited in a case of early departure from Board service.
Stock Ownership Guidelines
Our stock ownership guidelines set a stock ownership benchmark for non-employee directors of $325,000, or five times the cash portion of the base retainer. For this purpose, fully-owned shares, RSUs, and any shares held in tax-deferred plans are counted, but stock options are not counted. If the ownership guideline is satisfied, 50% of the net after-tax shares received from stock awards must be retained. If the guideline is not satisfied, 75% must be retained. The retention requirement applies during a director’s tenure on our Board, except that after age 60 directors are permitted to sell shares held at least three years to diversify in preparation for retirement. As Vice Chairman who is also an employee, Mr. Taylor’s ownership benchmark is six times his cash salary.
Non-Employee Director Compensation Table
The following table shows compensation earned last year by directors last year,other than Mr. Jordan, whether or not deferred.
Director Compensation 20162017
| (a) | (b) | (c) | (d) | (e) | (f) | (g) | (h) | |||||||||||
| Change in | ||||||||||||||||||
| Pension Value | ||||||||||||||||||
| and Nonqualified | ||||||||||||||||||
| Non-stock | Deferred | |||||||||||||||||
| Cash | Stock | Option | Incentive Plan | Compensation | All Other | |||||||||||||
| Retainers | Awards | Awards | Compensation | Earnings | Compensation | Total | ||||||||||||
| Name | ($) | ($) | ($) | ($) | ($) | ($) | ($) | |||||||||||
| Mr. Compton | $89,000 | $64,944 | — | — | — | $25,000 | $178,944 | |||||||||||
| Mr. Emkes | 97,000 | 64,944 | — | — | — | 25,000 | 186,944 | |||||||||||
| Mr. Gilchrist | 81,000 | 64,944 | — | — | — | 25,000 | 170,944 | |||||||||||
| Ms. Gregg | 18,250 | — | — | — | — | — | 18,250 | |||||||||||
| Mr. Martin | 77,000 | 64,944 | — | — | 8,638 | 25,000 | 175,582 | |||||||||||
| Mr. Niswonger | 73,000 | 64,944 | — | — | — | 25,000 | 162,944 | |||||||||||
| Ms. Palmer | 86,125 | 64,944 | — | — | 9,566 | 20,000 | 180,635 | |||||||||||
| Mr. Reed | 107,375 | 64,944 | — | — | — | 25,000 | 197,319 | |||||||||||
| Ms. Stewart | 80,500 | 64,944 | — | — | — | — | 145,444 | |||||||||||
| Mr. Subramaniam | 36,500 | 48,607 | — | — | — | — | 85,107 | |||||||||||
| Mr. Yancy | 83,000 | 64,944 | — | — | — | — | 147,944 | |||||||||||
| (a) | (b) | (c) | (d) | (e) | (f) | (g) | (h) | |||||||||||||||||||||
| Change in | ||||||||||||||||||||||||||||
| Pension Value | ||||||||||||||||||||||||||||
| and Nonqualified | ||||||||||||||||||||||||||||
| Fees Earned | Non-Equity | Deferred | ||||||||||||||||||||||||||
| or Paid in | Stock | Option | Incentive Plan | Compensation | All Other | |||||||||||||||||||||||
| Cash | Awards | Awards | Compensation | Earnings | Compensation | Total | ||||||||||||||||||||||
| Name | ($) | ($) | ($) | ($) | ($) | ($) | ($) | |||||||||||||||||||||
| Mr. Compton | $ | 91,000 | $ | 64,985 | — | — | — | $ | — | $ | 155,985 | |||||||||||||||||
| Mr. Emkes | 97,000 | 64,985 | — | — | — | 25,400 | 187,385 | |||||||||||||||||||||
| Mr. Foss | — | 18,944 | — | — | — | — | 18,944 | |||||||||||||||||||||
| Mr. Gilchrist | 81,000 | 64,985 | — | — | — | 25,000 | 170,985 | |||||||||||||||||||||
| Mr. Martin | 65,000 | 64,985 | — | — | 9,340 | 89,524 | 228,849 | |||||||||||||||||||||
| Mr. Niswonger | 73,000 | 64,985 | — | — | — | 25,000 | 162,985 | |||||||||||||||||||||
| Ms. Palmer | 90,500 | 64,985 | — | — | 10,344 | 25,000 | 190,829 | |||||||||||||||||||||
| Mr. Reed | 116,750 | 64,985 | — | — | — | 25,000 | 206,735 | |||||||||||||||||||||
| Ms. Stewart | 83,000 | 64,985 | — | — | — | — | 147,985 | |||||||||||||||||||||
| Mr. Subramaniam | 73,000 | 64,985 | — | — | — | 11,500 | 149,485 | |||||||||||||||||||||
| Mr. Yancy | 83,000 | 64,985 | — | — | — | — | 147,985 | |||||||||||||||||||||
| Mr. Taylor* | — | 2,099,995 | — | — | — | 153,381 | 2,253,376 | |||||||||||||||||||||
| * | As an employee Mr. Taylor does not participate in any non-employee director program. His compensation is governed largely by his employment agreement. See “Taylor Arrangements” below. |
Explanations of certain columns follow:
Col (c) Stock Awards. Includes RSUs granted to non-employee directors during calendar year 2016.2017. Amounts shown are the grant date fair values of
awards using the accounting method applicable to our financial statements. The accounting values are higher than the base retainer amount scheduled in the table above captioned “Director
| 81 |
| DIRECTOR COMPENSATION |
Compensation 2017-18” due to the value discount applied for the mandatory two-year payment deferral for those awards. For additional information about valuation see the note for colscolumns (e)-(f) to the Summary Compensation Table on page 58.67. Additional information about outstanding awards appears under the caption “Outstanding Director Equity Awards at Year-End” below. Mr. Martin’s RSUs are required to be shown even though they forfeited in December 2017. Cash paid in lieu of three quarters of the forfeited RSUs is included in column (g), effectively double counting the RSUs in column (h). For Mr. Taylor, this column shows the grant of a special restricted stock award required by his employment agreement. Mr. Taylor did not receive any regular stock awards in 2017. See “Taylor Arrangements” below for additional information.
Col (e) Incentive Plan Compensation. Non-employee directors do not receive cash incentives. We did not pay Mr. Taylor a cash incentive under our plans in relation to 2017.
Col (f) Deferred Compensation. Amounts consist of above-market interest accrued during the year under a plan discontinued in 1995.
Col (g) All Other Compensation. AmountsFor non-employee directors, amounts in this column consist of matching donations to eligible charitable organizations by First Horizon Foundation and cash attendance fees from regional board meetings. For Mr. Martin, the amount also includes $63,702 related to Mr. Martin’s retirement, substantially all of which consisted of cash paid in lieu of three-fourths of his 2017 RSU award, which forfeited automatically when he retired in December. For Mr. Taylor, this column includes cash salary ($67,308), bonus owed by Capital Bank and paid by us ($84,932), and the value of perquisites and other personal benefits ($1,141) paid during 2017. See “Taylor Arrangements” below for additional information.
Taylor Arrangements
Mr. Taylor signed an employment agreement with us in anticipation of our merger with Capital Bank Financial Corp. (“CBF”), of which he was Chief Executive Officer. His agreement provides a framework for his salary, bonus opportunity, a special stock-based award, and other employment matters during the agreement’s two-year term.
Mr. Taylor’s employment agreement provides for an annual base salary floor of $700,000 and an annual incentive payment of no less than 100% of base salary. He also is entitled to the continuation of certain welfare benefits which had been provided to him by CBF.
At the closing of the merger he received a special award of 108,303 shares of restricted stock. The award had a grant date value of $2.1 million and will vest on its second anniversary, subject to Mr. Taylor’s continued employment. Vesting of the award is required to accelerate if his employment is terminated without cause, he resigns with good reason, or his death or disability occurs, all as provided in the agreement.
Mr. Taylor’s agreement has specific provisions for compensation if his employment with us terminates under various circumstances:
| • | During the agreement’s term, if Mr. Taylor’s employment is terminated without cause or he resigns with good reason, he would be entitled to receive a lump sum cash payment equal to his base salary and the minimum annual incentive payment he would have received through the second anniversary of the merger closing, a prorated bonus for the year of termination (based on target performance), continued benefits for 36 months, and accelerated vesting of his special award mentioned above. |
| • | Upon Mr. Taylor’s death or disability during the agreement’s term, he would be entitled to receive a prorated bonus for the year of termination (based on target performance), accelerated vesting of the special award, and continued welfare benefits as described above. |
| • | If Mr. Taylor’s employment terminates at or after expiration of his agreement, he would be entitled to receive a prorated bonus for the year of termination (based on target performance) and continued welfare benefits as described above. |
If Mr. Taylor resigns without good reason or is terminated with cause during the term of the agreement, he would be entitled to continued welfare benefits as described above.
As an employee and officer, Mr. Taylor generally is eligible to participate in plans and programs applicable to our other employees and officers, subject to the terms of his employment agreement.
Outstanding Director Equity Awards at Year-End
Directors receive annual RSU awards, and hold option awards from an old deferral program, as
presented in the following table. All options are vested. All other awards were unvested at year-end.year-
end. Awards held by Mr. Jordan are omitted from the table; see “Outstanding Stock Awards at Fiscal Year-End” beginning on page 72 for additional information.
| 82 |
| DIRECTOR COMPENSATION |
Outstanding Equity Awards at Fiscal Year-End 20162017
Held by Non-Employee Directors
| (a) | (b) | (c) | (d) | (e) | (f) | (b) | (c) | (d) | (e) | (f) | ||||||||||||||||
| Stock Options | Restricted Stock or Unit Awards | Stock Options | Restricted Stock or Unit Awards | |||||||||||||||||||||||
| Number of | Number of | |||||||||||||||||||||||||
| Securities | Number of Shares | Market Value of | Securities | Number of Shares | Market Value of | |||||||||||||||||||||
| Underlying | Option | or Units of Stock | Shares or Units of | Underlying | Option | or Units of Stock | Shares or Units of | |||||||||||||||||||
| Unexercised | Exercise | Option | Held that Have Not | Stock that Have | Unexercised | Exercise | Option | Held that Have Not | Stock that Have | |||||||||||||||||
| Name | Options(#) | Price($/sh) | Expiration Date | Vested(#) | Not Vested($) | Options(#) | Price($/sh) | Expiration Date | Vested(#) | Not Vested($) | ||||||||||||||||
| Mr. Compton | — | — | — | 4,510 | $90,245 | — | — | — | 4,059 | $ | 81,139 | |||||||||||||||
| Mr. Emkes | — | 4,510 | $90,245 | — | — | — | 4,059 | $ | 81,139 | |||||||||||||||||
| Mr. Foss | — | — | — | 977 | $ | 19,530 | ||||||||||||||||||||
| Mr. Gilchrist | — | — | — | 4,059 | $ | 81,139 | ||||||||||||||||||||
| Mr. Martin | 0 | $ | 0 | |||||||||||||||||||||||
| 4,704 | $ | 22.26 | 6/30/2018 | |||||||||||||||||||||||
| 3,951 | 26.53 | 12/31/2018 | ||||||||||||||||||||||||
| 3,484 | 27.22 | 6/30/2019 | ||||||||||||||||||||||||
| 3,334 | 20.40 | 12/31/2019 | ||||||||||||||||||||||||
| 2,852 | 23.49 | 7/2/2021 | ||||||||||||||||||||||||
| 3,009 | 23.91 | 1/2/2022 | ||||||||||||||||||||||||
| 2,842 | 25.34 | 7/1/2022 | ||||||||||||||||||||||||
| 3,119 | 24.36 | 12/4/2022 | ||||||||||||||||||||||||
| Mr. Niswonger | — | — | — | 4,059 | $ | 81,139 | ||||||||||||||||||||
| Ms. Palmer | 4,059 | $ | 81,139 | |||||||||||||||||||||||
| 4,196 | $ | 22.26 | 6/30/2018 | |||||||||||||||||||||||
| 4,378 | 26.53 | 12/31/2018 | ||||||||||||||||||||||||
| 3,848 | 27.22 | 6/30/2019 | ||||||||||||||||||||||||
| 4,584 | 20.40 | 12/31/2019 | ||||||||||||||||||||||||
| 5,226 | 11.85 | 7/3/2020 | ||||||||||||||||||||||||
| 3,518 | 18.85 | 1/2/2021 | ||||||||||||||||||||||||
| 3,107 | 23.49 | 7/2/2021 | ||||||||||||||||||||||||
| 3,093 | 23.91 | 1/2/2022 | ||||||||||||||||||||||||
| 2,764 | 25.34 | 7/1/2022 | ||||||||||||||||||||||||
| 2,709 | 24.36 | 1/2/2023 | ||||||||||||||||||||||||
| 1,121 | 18.28 | 7/1/2023 | ||||||||||||||||||||||||
| 2,028 | 18.24 | 1/2/2024 | ||||||||||||||||||||||||
| Mr. Reed | — | — | — | 4,059 | $ | 81,139 | ||||||||||||||||||||
| Ms. Stewart | — | — | — | 4,059 | $ | 81,139 | ||||||||||||||||||||
| Mr. Subramaniam | — | — | — | 4,059 | $ | 81,139 | ||||||||||||||||||||
| Mr. Yancy | 4,059 | $ | 81,139 | |||||||||||||||||||||||
| 1,379 | $ | 23.91 | 1/2/2022 | |||||||||||||||||||||||
| 2,921 | 25.34 | 7/1/2022 | ||||||||||||||||||||||||
| 3,202 | 24.36 | 1/2/2023 | ||||||||||||||||||||||||
| 1,011 | 18.28 | 7/1/2023 | ||||||||||||||||||||||||
| 1,535 | 18.24 | 1/2/2024 | ||||||||||||||||||||||||
| Mr. Taylor* | — | — | — | 108,303 | $ | 2,164,977 | ||||||||||||||||||||
| * | As an employee Mr. Taylor does not participate in any non-employee director program. His stock award was required by his employment agreement. See “Taylor Arrangements” above. |
| (a) | (b) | (c) | (d) | (e) | (f) | |||||||||||||
| Stock Options | Restricted Stock or Unit Awards | |||||||||||||||||
| Number of | ||||||||||||||||||
| Securities | Number of Shares | Market Value of | ||||||||||||||||
| Underlying | Option | or Units of Stock | Shares or Units of | |||||||||||||||
| Unexercised | Exercise | Option | Held that Have Not | Stock that Have | ||||||||||||||
| Name | Options(#) | Price($/sh) | Expiration Date | Vested(#) | Not Vested($) | |||||||||||||
| Mr. Gilchrist | — | — | — | 4,510 | $ | 90,245 | ||||||||||||
| Ms. Gregg | — | — | ||||||||||||||||
| 55 | $ | 18.28 | 4/26/2017 | |||||||||||||||
| 70 | 18.24 | 4/26/2017 | ||||||||||||||||
| Mr. Martin | 4,510 | $ | 90,245 | |||||||||||||||
| 5,694 | $ | 17.10 | 6/30/2017 | |||||||||||||||
| 4,950 | 23.46 | 12/31/2017 | ||||||||||||||||
| 4,704 | 22.26 | 6/30/2018 | ||||||||||||||||
| 3,951 | 26.53 | 12/31/2018 | ||||||||||||||||
| 3,484 | 27.22 | 6/30/2019 | ||||||||||||||||
| 3,334 | 20.40 | 12/31/2019 | ||||||||||||||||
| 2,985 | 18.85 | 1/2/2021 | ||||||||||||||||
| 2,852 | 23.49 | 7/2/2021 | ||||||||||||||||
| 3,009 | 23.91 | 1/2/2022 | ||||||||||||||||
| 2,842 | 25.34 | 7/1/2022 | ||||||||||||||||
| 3,119 | 24.36 | 1/2/2023 | ||||||||||||||||
| 1,094 | 18.28 | 7/1/2023 | ||||||||||||||||
| 1,370 | 18.24 | 1/2/2024 | ||||||||||||||||
| Mr. Niswonger | — | — | — | 4,510 | $ | 90,245 | ||||||||||||
| Ms. Palmer | 4,510 | $ | 90,245 | |||||||||||||||
| 5,363 | $ | 17.10 | 6/30/2017 | |||||||||||||||
| 4,710 | 23.46 | 12/31/2017 | ||||||||||||||||
| 4,196 | 22.26 | 6/30/2018 | ||||||||||||||||
| 4,378 | 26.53 | 12/31/2018 | ||||||||||||||||
| 3,848 | 27.22 | 6/30/2019 | ||||||||||||||||
| 4,584 | 20.40 | 12/31/2019 | ||||||||||||||||
| 5,226 | 11.85 | 7/3/2020 | ||||||||||||||||
| 3,518 | 18.85 | 1/2/2021 | ||||||||||||||||
| 3,107 | 23.49 | 7/2/2021 | ||||||||||||||||
| 3,093 | 23.91 | 1/2/2022 | ||||||||||||||||
| 2,764 | 25.34 | 7/1/2022 | ||||||||||||||||
| 2,709 | 24.36 | 1/2/2023 | ||||||||||||||||
| 1,121 | 18.28 | 7/1/2023 | ||||||||||||||||
| 2,028 | 18.24 | 1/2/2024 | ||||||||||||||||
| Mr. Reed | — | — | — | 4,510 | $ | 90,245 | ||||||||||||
| Ms. Stewart | — | — | — | 4,510 | $ | 90,245 | ||||||||||||
| Mr. Subramaniam | — | — | — | 3,327 | $ | 66,573 | ||||||||||||
| Mr. Yancy | 4,510 | $ | 90,245 | |||||||||||||||
| 1,379 | $ | 23.91 | 1/2/2022 | |||||||||||||||
| 2,921 | 25.34 | 7/1/2022 | ||||||||||||||||
| 3,202 | 24.36 | 1/2/2023 | ||||||||||||||||
| 1,011 | 18.28 | 7/1/2023 | ||||||||||||||||
| 1,535 | 18.24 | 1/2/2024 | ||||||||||||||||
Explanations of certain columns follow:
Cols (b)/(c). Stock options include adjustments for stock dividends distributed 2008-2011, the cumulative compound rate of which was 20.0380%.
Col (e). All awards outstanding at year-endAwards held by non-employee directors are unvested RSUs which vest on April 2, 2017.2018. Mr. Taylor’s award consists of restricted stock scheduled to vest on November 30, 2019.
Col (f). Values reflect the year-end market value of our common stock ($20.01/19.99/share) with no discount for the risk that the award might be forfeited or for the time remaining before vesting. Values shown here are not based on financial accounting assumptions or methods.
| 83 |
| DIRECTOR COMPENSATION |
Details concerning the awards outstanding at year-end are provided in the following table.
Details Concerning Director Full-Value Stock Awards
Outstanding at Year-End 20162017
| Grant | Units/Shrs | |||||
| Name | Date | Vesting Date | Vesting (#) | |||
| Mr. Compton | 4/ | 4/2/ | ||||
| Mr. Emkes | 4/ | 4/2/2018 | 4,059 | |||
| Mr. Foss | 11/30/2017 | 977 | ||||
| Mr. Gilchrist | 4/ | 4/2/ | ||||
| Mr. Niswonger | 4/ | 4/2/ | ||||
| Ms. Palmer | 4/ | 4/2/ | ||||
| Mr. Reed | 4/ | 4/2/ | ||||
| Ms. Stewart | 4/ | 4/2/ | ||||
| Mr. Subramaniam | 4/2/ | |||||
| Mr. Yancy | 4/ | 4/2/2018 | 4,059 | |||
| Mr. Taylor | 11/30/2017 | 108,303 |
Director Options Exercised and Stock Vested
The following table provides information about stock options exercised during 20162017 by our non-employee directors as well as stock units and
restricted shares that vested during 2016.2017. Amounts in columns (c) and (e) represent the market values of shares on the exercise or vesting dates. Messrs. Foss and Taylor hold no
stock options and had no vestings in 2017, and so are omitted from this table. Information for Mr. Jordan also is omitted from the table; see “Options Exercised and Stock Vested” beginning on page 74 for his information.
Director Options Exercised and Stock Vested During 20162017
| (a) | (b) | (c) | (d) | (e) | ||||||||||||
| Option Awards | Stock Awards | |||||||||||||||
| Number of | ||||||||||||||||
| Shares | Value | |||||||||||||||
| Number of | Value Realized | Acquired or Units | Realized | |||||||||||||
| Shares Acquired | Upon Exercise | Paid Upon | Upon Vesting | |||||||||||||
| Name | on Exercise(#) | ($) | Vesting(#) | ($) | ||||||||||||
| Mr. Compton | — | — | 4,548 | $ | 60,216 | |||||||||||
| Mr. Emkes | — | — | 4,548 | 60,216 | ||||||||||||
| Mr. Gilchrist | — | — | 4,548 | 60,216 | ||||||||||||
| Ms. Gregg | — | — | 4,548 | 60,216 | ||||||||||||
| Mr. Martin | — | — | 4,548 | 60,216 | ||||||||||||
| Mr. Niswonger | — | — | 4,548 | 60,216 | ||||||||||||
| Ms. Palmer | 16,708 | $ | 82,578 | 4,548 | 60,216 | |||||||||||
| Mr. Reed | — | — | 5,533 | 74,153 | ||||||||||||
| Ms. Stewart | — | — | 4,548 | 60,216 | ||||||||||||
| Mr. Subramaniam | — | — | — | — | ||||||||||||
| Mr. Yancy | — | — | 4,548 | 60,216 | ||||||||||||
| (a) | (b) | (c) | (d) | (e) | ||||||||||||
| Option Awards | Stock Awards | |||||||||||||||
| Number of | ||||||||||||||||
| Shares | Value | |||||||||||||||
| Number of | Value Realized | Acquired or Units | Realized | |||||||||||||
| Shares Acquired | Upon Exercise | Paid Upon | Upon Vesting | |||||||||||||
| Name | on Exercise(#) | ($) | Vesting(#) | ($) | ||||||||||||
| Mr. Compton | — | — | 4,510 | $ | 82,939 | |||||||||||
| Mr. Emkes | — | — | 4,510 | 82,939 | ||||||||||||
| Mr. Gilchrist | — | — | 4,510 | 82,939 | ||||||||||||
| Mr. Martin* | 11,143 | $ | 5,781 | 7,554 | 144,641 | |||||||||||
| Mr. Niswonger | — | — | 4,510 | 82,939 | ||||||||||||
| Ms. Palmer | 5,363 | $ | 2,987 | 4,510 | 82,939 | |||||||||||
| Mr. Reed | — | — | 4,510 | 82,939 | ||||||||||||
| Ms. Stewart | — | — | 4,510 | 82,939 | ||||||||||||
| Mr. Subramaniam | — | — | 3,327 | 61,184 | ||||||||||||
| Mr. Yancy | — | — | 4,510 | 82,939 | ||||||||||||
| * | Mr. Martin’s 2017 RSU award, outstanding at his retirement, was forfeited automatically. After retirement the Board approved paying Mr. Martin the pro-rated cash value, at retirement, of the forfeited award. That payment-in-lieu is included in columns (d) and (e) as if the award had vested on those terms. |
| 84 |
| LEGAL MATTERS |
Section 16(a)16(a) Beneficial Ownership Reporting Compliance
Section 16(a) of the Securities Exchange Act of 1934, as amended, requires our directors and officers to file with the SEC initial reports of ownership and reports of changes in ownership of our stock and to furnish us with copies of all forms filed.
To our knowledge, based solely on a review of the copies of such reports furnished to us and written representations that no other reports were required, during the past fiscal year our officers and directors complied with all applicable Section 16(a) filing requirements.
Availability of Annual Report on Form 10-K
A copy of our Annual Report on Form 10-K, including the financial statements and schedules thereto, which is filed with the SEC, is available free of charge to each shareholder of record upon written request to the Treasurer, First Horizon National Corporation, P. O. Box 84, Memphis, Tennessee, 38101. Each such written request must set forth a good faith representation that as of the record date specified in the notice of annual shareholders’ meeting the person making the
request was a beneficial owner of a security
entitled to vote at the annual meeting of shareholders.
The exhibits to the Annual Report on Form 10-K will also be supplied upon written request to the Treasurer and payment to us of the cost of furnishing the requested exhibit or exhibits. A document containing a list of the exhibits to Form 10-K, as well as a brief description and the cost of furnishing each such exhibit, will accompany the Annual Report on Form 10-K.
We are required to disclose a comparison of the 2017 total compensation of our CEO with that of our median-paid employee. For that purpose, we have selected the median employee using total federally taxable income reported by us for 2017 to the U.S. Internal Revenue Service. The median employee was that person, employed by us at year-end, whose 2017 taxable income ranked at the fiftieth percentile of all our employees other than the CEO. For this purpose, all employees included part-time and seasonal personnel as well as persons who joined us during the year. However, as permitted by applicable disclosure rules, in choosing the median employee we omitted all persons who became our employees as a result of our merger with Capital Bank Financial Corp. late in 2017.
Total compensation for our CEO in 2017, calculated using the methodology reported on pages 67 – 68, was $10,333,764. Included within that total is a special multi-year cash bonus of $5,500,000, discussed at page 62 above under the caption “CEO Multi-Year Cash Bonus.” Excluding that special bonus, CEO total compensation would have been $4,833,764. Total compensation for our median employee for 2017, calculated using the same methodology, was $81,836. The ratio of 2017 total compensation for the CEO in relation to that for the median employee is one hundred twenty six to one. Excluding the CEO’s special bonus, that ratio is fifty nine to one.
| 85 |
| LEGAL MATTERS |
Late in 2017 we announced that approximately 4,000 non-bonus-eligible, non-commission employees would receive a special cash bonus of $1,000. The median employee was one of those who received that bonus, which was included in calculating the ratios above.
The information disclosed in this section was developed and is provided solely to comply with
specific, new legal requirements. We do not use any of this information in managing our company. We do not believe this information provides shareholders with a useful mechanism for evaluating our management’s effectiveness, operating results, or business prospects, nor for comparing our company with any other in any meaningful respect.
BY ORDER OF THE BOARD OF DIRECTORS


Clyde A. Billings, Jr.
Senior Vice President,
Assistant General Counsel and
Corporate Secretary
March 13, 201712, 2018
| 86 |
| APPENDIX A—AUDIT COMMITTEE CHARTER |
AUDIT COMMITTEE CHARTER
FIRST HORIZON NATIONAL CORPORATION
(As Amended and Restated as of July 25, 2017)
Establishment and Purposes of the Committee
Acting pursuant to Tennessee Code Annotated Section 48-18-206, Article 11(b)(8) of the Corporation’s restated charter, as amended, and Section 3.5 of the Corporation’s bylaws, as amended, the Board of Directors of First Horizon National Corporation hereby creates the Audit Committee (the “Committee”) of the Board of Directors, which shall: (1) assist the Board of Directors in its oversight of (a) the Corporation’s accounting and financial reporting principles and policies and internal controls and procedures, (b) the integrity of the Corporation’s financial statements, (c) the Corporation’s compliance with legal and regulatory requirements, (d) the independent auditor’s qualifications and independence, and (e) the performance of the independent auditor and Corporation’s internal audit function; and (2) prepare the report to be included in the Corporation’s annual proxy statement pursuant to the proxy rules of the Securities and Exchange Commission (“SEC”).
The function of the Committee is oversight. Management of the Corporation is responsible for preparation, presentation and integrity of the Corporation’s financial statements. Management is responsible for maintaining appropriate accounting and financial reporting principles and policies and internal controls and procedures to provide for compliance with accounting standards and applicable laws and regulations, and the officer in charge of the Corporation’s internal audit function (“internal auditor”) is responsible for testing such internal controls and procedures. The independent auditor is responsible for planning and carrying out a proper audit of the Corporation’s annual financial statements, reviews of the Corporation’s quarterly financial statements prior to the filing of each quarterly report on Form 10-Q, and other procedures. It is recognized that, in fulfilling their responsibilities hereunder, members of the Committee are not full-time employees of the Corporation and are not, and do not represent themselves to be, performing the functions of accountants or auditors. As such, it is not the duty or responsibility of the Committee or its members to conduct “field work” or other types of auditing or accounting reviews or procedures or to set auditor independence standards, and each member of the Committee shall be entitled to rely on (1) the integrity of those persons and organizations within and outside the Corporation from which it receives information, (2) the accuracy of the financial and other information provided to the Committee by such persons or organizations absent actual knowledge to the contrary (which shall be promptly reported to the Board) and (3) the representations made by management as to any non-audit services provided by the independent auditor to the Corporation. Further, in fulfilling their responsibilities hereunder, the members of the Committee will incorporate the use of reasonable materiality standards, including the size of the Corporation and the nature, scope and risks of the activities conducted.
The independent auditor for the Corporation is accountable to the Committee as representatives of the shareholders and must report directly to the Committee. The Committee has the authority and responsibility directly to appoint (subject, if applicable, to shareholder ratification), retain, compensate, evaluate and terminate the Corporation’s independent auditor and to oversee the work of such independent auditor.
The independent auditor shall submit to the Committee annually a formal written statement (the “Auditor’s Statement”) describing: the independent auditor’s internal quality-control procedures; any material issues raised by the most recent internal quality-control review or peer review of the independent auditor, or by any inquiry or investigation by governmental or professional authorities, within the preceding five years, respecting one or more independent audits carried out by the independent auditor, and any steps taken to deal with such issues; and (to assess the independent auditor’s independence) all relationships between the independent auditor and the Corporation addressing each non-audit service provided to the Corporation and at least the matters set forth in the applicable requirements of the Public Company Accounting Oversight Board regarding the independent auditor’s communications with the Audit Committee concerning independence.
The independent auditor shall submit to the Committee annually a formal written statement of the aggregate fees billed for each of the last two fiscal years for professional services rendered by the independent auditor in the following categories (as defined by the rules of the SEC): audit, audit-related, tax and all other services.
| A-1 |
| APPENDIX A—AUDIT COMMITTEE CHARTER |
Qualifications of Committee Members
The Committee shall consist of at least three members appointed annually by a majority of the entire Board on the recommendation of the Nominating and Corporate Governance Committee of the Board of Directors, acting in its capacity as the nominating committee.
Members shall be directors who meet the independence and experience requirements of the NYSE and Section 10A(m)(3) of the Securities Exchange Act of 1934, as amended, and the rules of the SEC promulgated thereunder. Under these requirements as currently adopted, the Board must determine:
| • | that each member has no material relationship, either direct or indirect, with the Corporation; | |
| • | that each member is financially literate, or shall become financially literate within a reasonable period of time after his or her appointment to the Committee; and | |
| • | that at least one of the members has accounting or related financial management expertise, | |
| as such requirements are interpreted by the Board of Directors in the exercise of its business judgment. Members may be replaced by the Board. | ||
No director may serve as a member of the Committee if such director serves on the audit committees of more than two other public companies unless the Board of Directors determines that such simultaneous service would not impair the ability of such director to serve effectively on the Committee, and discloses this determination in the Corporation’s annual proxy statement. No member of the Committee may be an affiliated person (as such term is defined in SEC Rule 10A-3, including any exceptions or exemptions permitted thereby) of the Corporation or any subsidiary thereof or may receive any compensation from the Corporation other than (i) director’s fees, which may be received in cash, stock options or other in-kind consideration ordinarily available to directors; (ii) a pension or other deferred compensation for prior service that is not contingent on future service; and (iii) any other regular benefits that other directors receive; provided, however, that notwithstanding the foregoing, it shall be permissible for Committee members to receive those types of compensation permitted by the rules of the SEC and the NYSE regarding the independence of audit committee members.
Operation of the Committee
Meetings shall be held at least four times yearly, or more frequently if circumstances dictate, and may be called at any time by the Committee chair or by any two members of the Committee upon written or oral notice to a majority of the members of the Committee prior to the meeting. A quorum shall consist of a majority of the members and the vote of a majority of the members present at a meeting at which a quorum is present shall be the act of the Committee. Proceedings of the Committee over the signature of a member in attendance shall be recorded in a minute book and reflect the names of those in attendance. The chair of the Committee, or acting chair of the meeting, will present a report of Committee activities to the full Board of Directors at its next regularly scheduled meeting. The Secretary of the Board will permanently maintain the minutes of Committee meetings. Meetings may be held jointly with a similar committee of First Tennessee Bank National Association (“Bank”) if either the members of the Bank’s committee and the members of this Committee are identical or all of the members of the Bank’s committee would meet the eligibility requirements of the NYSE, Section 10A(m)(3) and the rules of the SEC, including any exceptions permitted thereby, and meetings may also be held jointly with the Trust Audit Committee of the Bank under the same conditions. The Committee may, in its discretion, delegate all or a portion of its authority and duties to a subcommittee of the Committee, and may delegate to the chair the authority to grant pre-approvals of audit and permitted non-audit services as provided herein, provided that the decisions of such chair to grant pre-approvals shall be presented to the full Committee at its next regularly scheduled meeting.
The Committee shall have unrestricted access to Corporation personnel and documents. The Committee will be given the resources and authority appropriate to discharge its duties and responsibilities, including (i) the authority to retain and compensate special or independent counsel, accountants or other experts or consultants to advise the Committee, without seeking approval of the Board or management, and (ii) appropriate funding, as determined by the Committee, for payment of compensation to such counsel, accountants or other experts and consultants. The Committee may request any officer or employee of the Corporation or of the Corporation’s outside counsel or independent auditor to attend a meeting of the Committee or to meet with any members of, or consultants to, the Committee. It will be the responsibility of the Committee to maintain free and open means of communication between the directors and
| A-2 |
| APPENDIX A—AUDIT COMMITTEE CHARTER |
management of the Corporation. The Committee shall meet separately periodically with management, the internal auditor, and the independent auditor in separate executive sessions to discuss any matters that the Committee or any of these persons believes should be discussed privately.
Duties and Responsibilities of the Committee
The Committee is hereby delegated full authority with respect to the following matters and such additional matters as may be provided in the bylaws of the Corporation or as the Board of Directors may from time to time by resolution adopted by a majority of the entire Board specify:
| 1. | with respect to the independent auditor, | |
| a. | directly appoint (subject, if applicable, to shareholder ratification), retain, compensate, oversee the work of, evaluate and terminate the independent auditor. | |
| b. | adopt a policy for the Corporation regarding preapproval of all audit and non-audit engagement fees and terms and approve, in advance, all such fees and terms in accordance with such policy. | |
| c. | ensure that the independent auditor prepares and delivers annually an Auditor’s Statement (it being understood that the independent auditor is responsible for the accuracy and completeness of this Statement) and consider such Auditor’s Statement in assessing the independence of the independent auditor. | |
| d. | ensure that the independent auditor timely reports on all critical accounting policies and practices to be used; all alternative treatments of financial information within generally accepted accounting principles that have been discussed with management, ramifications of the use of such alternative disclosures and treatments, and the treatment preferred by the independent auditor; and other material written communications between the independent auditor and management, such as any management letter or schedule of unadjusted differences. | |
| e. | review and evaluate the qualifications, performance and independence of the lead partner of the independent auditor. | |
| f. | discuss with management the timing and process for implementing the rotation of the lead audit partner, the concurring partner, and any other active audit engagement team partner and consider whether there should be a regular rotation of the audit firm itself. | |
| g. | instruct the independent auditor that the independent auditor is ultimately accountable to the Committee as representatives of the shareholders. | |
| 2. | with respect to the internal audit department, | |
| a. | appoint and remove the Corporation’s internal auditor and approve the salary and annual bonus of the internal auditor. | |
| b. | advise the internal auditor that he or she is expected to provide the Committee summaries of and, as appropriate, significant reports to management prepared by the internal audit department and management’s responses thereto (including but not limited to reports on the Corporation’s risk governance, risk assessment and risk management, the adequacy of policies, and compliance with legal and regulatory requirements). | |
| c. | advise the internal auditor that he or she is expected to provide the Committee with such additional information and reports as may be provided in the internal audit department charter. | |
| d. | approve the internal audit department charter, review it annually, and approve such amendments thereto as the Committee may deem necessary or appropriate. | |
| e. | approve annually the audit plan, and risk assessment methodology of the internal audit department. | |
| f. | review annually the financial budget of the internal audit department. | |
| g. | together with the internal auditor, oversee any outsourcing to third parties of internal audit functions. | |
| 3. | with respect to financial reporting principles and policies and internal controls and procedures, | |
| a. | advise management, the internal auditor and the independent auditor that each is expected to provide to the Committee a timely analysis of significant financial reporting issues and practices. | |
| A-3 |
| APPENDIX A—AUDIT COMMITTEE CHARTER |
| b. | consider any reports or communications (and management’s and/or the internal auditor’s responses thereto) submitted to the Committee by the independent auditor required by or referred to in Auditing Standard No. 1301, or any successor provision. Communication with Audit Committees, issued by the Public Company Accounting Oversight Board, as may be modified or supplemented. | |
| c. | meet with management, the independent auditor and, if appropriate, the internal auditor (i) to discuss the scope of the annual audit; the audited financial statements and quarterly financial statements; any significant matters arising from any audit, including any audit problems or difficulties and management’s response thereto; any significant matters arising from changes to the Corporation’s auditing and accounting principles, policies, controls, procedures and practices proposed or contemplated by the independent auditor, the internal auditor or management; any major issues regarding accounting principles and financial statement presentations; any major issues as to the adequacy of the Corporation’s internal controls and any special audit steps adopted in light of material control deficiencies; analyses prepared by management and/or the independent auditor setting forth significant financial reporting issues and judgments made in connection with the preparation of the financial statements; the effect, if significant, of regulatory and accounting initiatives, as well as off-balance sheet structures, on the financial statements of the Corporation; (ii) to review the form of opinion the independent auditor proposes to render to the Board of Directors and shareholders; and (iii) to discuss the Corporation’s risk assessment and risk management policies and to inquire about significant risks and exposures, if any, and the steps taken to monitor and minimize such risks. | |
| d. | obtain from the independent auditor assurance that the audit was conducted in a manner consistent with Section 10A of the Securities Exchange Act of 1934, as amended, which set forth certain procedures to be followed in any audit of financial statements required under that act. | |
| e. | review any employee complaints or material reports or inquiries received from regulators or government agencies and management’s responses; in addition to receiving reports from the internal auditor regarding risk and compliance matters as described in Section 2 of this Charter, meet periodically with the Corporation’s chief risk officer to discuss any risk and compliance matters that may have a material effect on the Corporation’s financial statements or internal controls; discuss any significant compliance issues raised in reports or inquiries received from regulators or government agencies; review periodic reports regarding the effectiveness of the Compliance and Ethics Program; and discuss with the Corporation’s General Counsel pending and threatened claims that may have a material impact on the financial statements. | |
| f. | discuss earnings press releases, including the use of “proforma” or “adjusted” non-GAAP information, as well as financial information and earnings guidance provided to analysts and rating agencies; provided, however, that the Committee’s responsibility to discuss earnings releases as well as financial information and earnings guidance may be done generally and may be limited to the types of information to be disclosed and the types of presentations to be made. | |
| g. | establish hiring policies for employees or former employees of the independent auditor. | |
| h. | review and oversee related party transactions. | |
| i. | establish procedures for the receipt, retention and treatment of complaints received by the Corporation regarding accounting, internal accounting controls or auditing matters, and for the confidential anonymous submission by the Corporation’s employees of concerns regarding questionable accounting or auditing matters. | |
| j. | review disclosures made to the Committee by the Corporation’s CEO and CFO during their certification process for the Form 10-K and Form 10-Q about any significant deficiencies in the design or operation of internal controls or material weaknesses therein and any fraud involving management or other employees who have a significant role in the Corporation’s internal controls. | |
| 4. | with respect to reporting and recommendations, | |
| a. | prepare any report or other disclosures, including any recommendation of the Committee, required by the rules of the SEC to be included in the Corporation’s annual proxy statement. | |
| b. | review this Charter at least annually and recommend any changes to the Board. | |
| A-4 |
| APPENDIX A—AUDIT COMMITTEE CHARTER |
| c. | report its activities to the full Board of Directors on a regular basis and make such recommendations with respect to the above and other matters as the Committee may deem necessary or appropriate. | |
| d. | prepare and review with the Board an annual performance evaluation of the Committee, which evaluation must compare the performance of the Committee with the requirements of this Charter. The performance evaluation by the Committee shall be conducted in such manner as the Committee deems appropriate. The report to the Board may take the form of an oral report by the chair of the Committee or any other member of the Committee designated by the Committee to make this report. |
| A-5 |
| APPENDIX B—SECTIONS OF RESTATED CHARTER PROPOSED TO BE AMENDED |
PROVISIONS OF THE
RESTATED CHARTER OF
FIRST HORIZON NATIONAL CORPORATION
AFFECTED BY VOTE ITEM NO. 2,
WITH PROPOSED CHANGES MARKED
* * * * *
| ARTICLE 5 |
Proposed New Article 5
5. PURPOSES AND POWERS.
The Corporation is organized: to conduct one or more financial services businesses, including any and all related, ancillary, or supportive businesses; to own other companies or enterprises (or interests therein) which conduct financial services businesses, including any and all related, ancillary, or supportive businesses; to engage in any lawful act or activity for which corporations may be organized now or hereafter under the Tennessee Business Corporation Act or other statutes or law of Tennessee; and for every other lawful purpose or purposes. Except as provided otherwise in this Restated Charter, the Corporation has each and every power enumerated in or permitted now or hereafter by the statutes or law of Tennessee, and all powers ancillary thereto.
Current Article 5, which would be replaced
5. PURPOSES.
The purpose or purposes for which the Corporation is organized are, to the extent permitted by law:
(a) To subscribe for, purchase, lease or otherwise acquire and to receive, own, hold, sell, exchange, lease, mortgage, pledge, assign or otherwise dispose of, and otherwise deal in and with “securities” (as such term is herein defined) issued or created by, or other property (real or personal) of any person, corporation, association, firm, trust, organization or other entity whatsoever, including but not limited to this corporation and any national banking association, state-chartered bank, savings bank and trust company, wherever located or organized and whether public, private or municipal, of this state, or any district, territory, subdivision, municipality or department thereof, or any other state or any district, territory, subdivision, municipality or department thereof, or any country, nation or government, or any district, territory, subdivision, municipality or department thereof; to possess and exercise any and all rights, powers and privileges of ownership of such securities or other property, including without limitation the right to vote on such securities; and to issue or deliver in payment or exchange, in whole or in part, for any such securities or other property, its own stock, bonds, notes or other obligations, or to make payment for any such securities or other property by any other lawful means; and to do any and all acts and things necessary or advisable for the preservation, protection, improvement or enhancement in value of any such securities or other property. The term “securities” as used in this Article 5 shall mean any and all shares, stocks, bonds, debentures, notes, mortgages, acceptances, evidences of indebtedness or obligations, certificates of interest or participation in any property or venture, scrip, interim receipts, voting trust certificates, instruments or interests commonly known as securities, and any and all certificates of interest or participation in, or of deposit of, any of the foregoing, or receipts for, guaranties of, or warrants or rights to subscribe for or purchase any of the foregoing.
(b) To promote, finance and assist, financially or otherwise, whether by loan, guaranty, subsidy or otherwise, any person, corporation, partnership, association, firm, trust, organization or other entity in which the Corporation shall have any interest; to guarantee the payment of dividends on any stock or the payment of the obligations issued or incurred by any such person, corporation, partnership, association, firm, trust, organization or other entity, to issue its own stock, bonds or other obligations in payment or exchange for any securities or other property acquired (pursuant to a merger, consolidation or otherwise) by any such person, corporation, partnership, association, firm, trust, organization or other entity; and to do any and all other acts and things for the enhancement, protection or preservation of any securities which are in any manner, directly or indirectly, owned, held or guaranteed by the Corporation.
| B-1 |
| APPENDIX B—SECTIONS OF RESTATED CHARTER PROPOSED TO BE AMENDED |
(c) To render assistance, service, counsel and advice to, and to act as representative in any capacity (whether managing, operating, financial, purchasing, selling, advertising or otherwise) of any person, corporation, partnership, association, firm, trust, organization or other entity, including without limitation those in which the Corporation shall have any interest.
(d) To acquire by purchase, lease, exchange or otherwise, to own, hold, use, manage, develop, improve and to sell, lease, mortgage, exchange and otherwise deal in, real estate and any interest or right therein and personal property of every class and description, either for is own account or for the account of others, to erect, construct, rebuild, repair, manage and control, lease, buy and sell, any and all kinds of and interest in real estate and personal property; and to engage generally in the business of operating and leasing real estate and personal property of every character and description.
(e) To buy, sell, produce, manufacture and dispose of all kinds of goods, documents, instruments, general intangibles, chattel paper, accounts, contract rights, wares, foods, potables, merchandise, manufactures, commodities, furniture, machinery, tools, supplies and products of any kind, character or description whatsoever, and generally to engage in any mercantile, manufacturing or commercial business of any kind or character whatsoever throughout the world, and to do all things incidental to any such business or businesses.
(f) To enter into any lawful arrangements for sharing profits, union of interest, reciprocal concession or cooperation, with any corporation, association, partnership, syndicate, entity, person or governmental, municipal or public authority, domestic or foreign in the carrying on of any business which the Corporation is authorized to carry on or any business or transaction deemed necessary, convenient or incidental to carrying out any of the purposes of the Corporation.
(g) To issue bonds, debentures, convertible debentures, notes, commercial paper, or other obligations of this Corporation, from time to time for any of the objects or purposes of the Corporation and to secure the same by mortgage, pledge, deed of trust or otherwise.
(h) To guarantee obligations of any other entity and to secure such guaranties by mortgage, pledge or otherwise by vote of a majority of the entire Board of Directors.
(i) To indemnify the officers and directors during their term of office or thereafter for actions arising during their term of office, either directly or through the purchase of insurance, for expenditures as parties to suits by or in the right of the Corporation or other than by or in the right of the Corporation to the extent permitted by the statutes of Tennessee.
(j) Without in any way limiting any of the objects or purposes or powers, whether primary or secondary of the Corporation, it is hereby expressly declared and provided that the Corporation shall have power to do all acts or things necessary, incidental or convenient to do, or calculated, directly or indirectly, to promote the interest of the Corporation, or enhance the value or render profitable any of its property or rights; and in carrying on its business or businesses, or for the purpose of obtaining or furthering any of its objects, to do any and all things and exercise any and all powers, rights and privileges which a corporation for profit may now or hereafter be permitted to do or to exercise under the laws of the State of Tennessee; and to do any and all of the acts and things herein set forth to the same extent as natural persons could do, and in any part of the world, as principal, factor, agent, contractor, trustee or otherwise, either alone or in syndicates, or otherwise in conjunction with any person, entity, syndicate, partnership, association or corporation, governmental or public bodies or authorities of any kind, domestic or foreign; to establish and maintain offices and agencies and to exercise all or any of its corporate powers and rights throughout the world.
(k) To engage, in addition to the foregoing, in any lawful act or activity for which corporations may be organized under the Tennessee General Corporation Act.
(l) It is the intention that the objects, purposes and powers specified in the fifth paragraph hereof shall, except where otherwise specified in said paragraph, be no-wise limited or restricted by reference to or inference from the terms of any other clause or paragraph in this Charter, but that the objects, purposes and powers specified in the fifth paragraph and in each of the clauses or paragraphs of this Charter shall be regarded as independent objects, purposes and powers.
The foregoing clauses shall be construed both as purposes and powers, and it is hereby expressly provided that the foregoing enumeration of specific powers shall not be held to limit or restrict in any manner the powers of this Corporation.
* * * * *
| B-2 |
| APPENDIX B—SECTIONS OF RESTATED CHARTER PROPOSED TO BE AMENDED |
| ARTICLES 7 & 8 |
Proposed reservation of Articles 7 and 8, after deletion
7. [reserved]
8. [reserved]
Current Articles 7 and 8, proposed to be deleted as no longer necessary
7. COMMENCEMENT OF BUSINESS.
The Corporation will not commence business until consideration of One Thousand Dollars ($1,000.00) has been received for the issuance of shares.
8. PREEMPTIVE RIGHTS.
No shareholder of the Corporation shall because of his ownership of stock have a preemptive or other right to purchase, subscribe for or take any part of any stock or any part of the notes, debentures, bonds or other securities convertible into or carrying options or warrants to purchase stock of the Corporation issued, optioned or sold by it after its incorporation. Any part of the capital stock and any part of the notes, debentures, bonds or other securities convertible into or carrying options or warrants to purchase stock of the Corporation authorized by this Restated Charter or by any amendment duly filed, may at any time be issued, optioned for sale and sold or disposed of by the Corporation pursuant to a resolution of its Board of Directors to such persons and upon such terms as may to such Board seem proper without first offering such stock or securities or any part thereof to existing shareholders.
* * * * *
| ARTICLE 10, FIRST PARAGRAPH |
Proposed changes to the first paragraph of Article 10
10. SERIAL PREFERRED STOCK.
The shares of any preferred class may be divided into and issued in series. If the shares of any such class are to be issued in series, then each series shall be so designated to distinguish the series thereof from all the shares of all other series and classes. All shares of the same series shall be identical. Any or all of the series of any class may vary in the relative rights and preferences as between the different series to the extent permitted by the statutes of Tennessee. The Board of Directors shall have the authority to divide any or all such classes into series and, within the limitation of the statutes and law ofthe State of Tennessee,and particularlySection 48-16-102 of the Tennessee Business Corporation Act or any successor provision theretoSections 48-502 and 48-503, fix and determine the relative rights and preferences of the shares of any series so established.
* * * * *
| ARTICLE 11 |
Proposed New Article 11
11. MANAGEMENT BY BOARD OF DIRECTORS.
(a) All corporate powers shall be exercised by, and the business and affairs of the Corporation shall be managed under the direction of, the Board of Directors. The Board of Directors may exercise all powers conferred or permitted by the statutes or law of Tennessee.
(b) Without in any way limiting any of the objects or purposes or powers of the Board of Directors, whether primary or secondary, it is hereby expressly declared and provided that the Board of Directors shall have the power to remove any director for cause, within the meaning of applicable statutes or law of Tennessee, by a vote of a majority of the entire Board of Directors.
| B-3 |
| APPENDIX B—SECTIONS OF RESTATED CHARTER PROPOSED TO BE AMENDED |
Current Article 11, which would be replaced
11. ADDITIONAL POWERS.
(a) The Corporation shall have the right to purchase, take, receive or otherwise acquire, hold, own, pledge, transfer or otherwise dispose of its own shares; but purchases of its own shares, whether direct or indirect, shall be made only to the extent of unreserved and unrestricted earned or capital surplus available therefor.
(b) Other provisions: Management. The Corporation shall be managed by the Board of Directors, which shall exercise all powers conferred under the laws of the State of Tennessee including without limitation the power:
(1) To hold meetings, to have one or more offices, and to keep the books of the corporation, except as otherwise expressly provided by law, at such places, whether within or without the State of Tennessee, as may from time to time be designated by the Board.
(2) To make, alter and repeal bylaws of the corporation, subject to the reserved power of the shareholders to make, alter and repeal bylaws.
(3) To approve the issuance or sale of any of its authorized but unissued shares of any class, bonds or other securities and rights or options entitling the holders thereof to purchase from the corporation shares of any class or classes, to approve the purchase or other acquisition of or the reissuance, sale or other disposition of treasury shares; to fix the consideration to be received for such shares of any class, bonds or other securities, rights or options and to cause to be issued any such shares of any class, bonds or other securities, rights or options.
(4) To use or apply any funds of the corporation lawfully available therefor for the purchase or acquisition of shares of the capital stock or bonds or other securities of the corporation, in the market or otherwise, at such price as may be fixed by the Board, and to such extent and in such manner and for such purposes and upon such terms as the Board may deem expedient and as may be permitted by law, and to sell, exchange, transfer, reissue or cancel such shares of the capital stock of the corporation upon such terms and for such consideration as it may deem proper.
(5) To determine whether and to what extent and at what times and places and under what conditions and regulations the accounts and books of the corporation, or any of them, shall be open to the inspection of the shareholders, and no shareholder shall have any right to inspect any account, record, book or document of the corporation, except as conferred by the laws of the State of Tennessee or as authorized by the Board.
(6) To remove any director for cause as defined by the laws of the State of Tennessee by a vote of a majority of the entire Board of Directors.
(7) To fill any newly created directorships resulting from an increase in the number of directors and any vacancies occurring in the Board for any reason, (including removal of directors without cause by the shareholders or for cause by the Board of Directors or the shareholders.)
(8) To designate an Executive Committee consisting of two or more directors and such other committees consisting of two or more persons, who may or may not be directors, and to delegate to such Executive Committee and other committees all such authority of the Board that it deems desirable within the limits prescribed by the statutes of the State of Tennessee.
(9) To designate the officer or officers of the corporation who shall vote the shares of capital stock held by the corporation in other corporations and to authorize the execution of any proxy that may be necessary in connection therewith.
(10) To take any action required or permitted of the Board without a meeting on written consent, setting forth the action so taken, sighed by all directors entitled to vote thereon.
* * * * *
| B-4 |
| APPENDIX B—SECTIONS OF RESTATED CHARTER PROPOSED TO BE AMENDED |
| ARTICLE 14 |
Proposed change to Article 14
14. DIRECTOR LIABILITY.
No director shall be personally liable to the Corporation or its shareholders for monetary damages for breach of fiduciary duty as director, except for liability (i) for any breach of the director’s duty of loyalty to the Corporation or its shareholders, (ii) for acts or omissions not in good faith or which involve intentional misconduct or a knowing violation of law, or (iii) under Section48-18-30248-18-304, or any successor provision thereto, of the Tennessee Business Corporation Act.
* * * * *
| B-5 |
| APPENDIX C—RECONCILIATION OF NON-GAAP TO GAAP FINANCIAL INFORMATION |
RECONCILIATION OF NON-GAAP TO GAAP
FINANCIAL INFORMATION
Portions of this Proxy Statement show financial measures that are not presented according to generally accepted accounting principles (GAAP). Non-GAAP financial measures are noted in this Proxy Statement when used. A reconciliation of those non-GAAP measures to comparable GAAP measures is provided in this appendix.
Although non-GAAP measures have no standard definition, our management believes the measures presented in this Proxy Statement are useful for understanding our financial results. Non-GAAP measures are reported to our management and Board of Directors through various internal reports.
The non-GAAP financial measures used in this Proxy Statement are: adjusted earnings per share (EPS), adjusted return on assets (ROA), adjusted return on equity (ROE), return on tangible common equity (ROTCE), adjusted ROTCE, and adjusted efficiency ratio, all for the fiscal year 2017. All adjusted measures exclude from GAAP measures certain “notable items” which are listed in the table below. The amount of each notable item is listed to show relative size. Except for the tax-related adjustments, amounts shown are pretax, and do not flow directly into adjustment calculations. While the selection of which items identified as “notable” is inherently subjective, we believe that the exclusion of these positive and negative notable items from our reported GAAP operating results for 2017 presents a more useful baseline for comparisons to other years. Certain calculated amounts do not add, subtract, or divide precisely as shown due to rounding.
| 2017 NOTABLE ITEMS |
| Item | Amount | * | |||
| Mortgage repurchase reserve release (positive) | $ | 20.0 | |||
| Acquisition expense | 61.3 | ||||
| Legal (litigation) expense | 40.3 | ||||
| Tax adjustments unrelated to Tax Reform (positive) | 43.9 | ||||
| Adjustments related to Tax Reform (negative) | 82.0 | ||||
| Special employee bonus expense | 9.9 | ||||
| * $ | in millions | ||||
| 2017 ADJUSTED EPS |
| Item | Amount | * | |||
| Net Income available to common shareholders (NIAC) (GAAP) | $ | 159 | |||
| Average Common Diluted Shares (GAAP) | 244 | ||||
| EPS (NIAC/Avg Shares) (GAAP) | $ | 0.65 | per share | ||
| NIAC (GAAP) | $ | 159 | |||
| Exclude notable items from NIAC | + 112 | ||||
| Adjusted NIAC (non-GAAP) | 271 | ||||
| Average Common Diluted Shares (GAAP) | 244 | ||||
| Adjusted EPS (Adj NIAC/Avg Shares) (non-GAAP) | $ | 1.11 | per share | ||
| * $ | & shrs in millions, except EPS | ||||
| C-1 |
| APPENDIX C—RECONCILIATION OF NON-GAAP TO GAAP FINANCIAL INFORMATION |
| 2017 ADJUSTED ROA |
| Item | Amount | * | |||
| Net Income available to common shareholders (NIAC) (GAAP) | $ | 159 | |||
| Average Assets (GAAP) | 29,925 | ||||
| ROA (NIAC/Avg Assets) (GAAP) | 0.59% | ||||
| NIAC (GAAP) | $ | 159 | |||
| Exclude notable items from NIAC | + 112 | ||||
| Adjusted NIAC (non-GAAP) | 271 | ||||
| Average Assets (GAAP) | 29,925 | ||||
| Adjusted ROA (Adj NIAC/Avg Assets) (non-GAAP) | 0.96% | ||||
| * $ | in millions | ||||
| 2017 ADJUSTED ROE |
| Item | Amount | * | |||
| Net Income available to common shareholders (NIAC) (GAAP) | $ | 159 | |||
| Average Common Equity (CE) (GAAP) | 2,579 | ||||
| ROE (NIAC/CE) (GAAP) | 6.2% | ||||
| NIAC (GAAP) | $ | 159 | |||
| Exclude notable items from NIAC | + 112 | ||||
| Adjusted NIAC (non-GAAP) | 271 | ||||
| CE (GAAP) | 2,579 | ||||
| Exclude impact on CE of notable items | – 49 | ||||
| Adjusted CE (non-GAAP) | 2,530 | ||||
| Adjusted ROE (Adj NIAC/Adj CE) (non-GAAP) | 10.7% | ||||
| * $ | in millions | ||||
| 2017 ROTCE and ADJUSTED ROTCE |
| Item | Amount | * | |||
| Net Income available to common shareholders (NIAC) (GAAP) | $ | 159 | |||
| Average Common Equity (CE) (GAAP) | 2,579 | ||||
| ROE (NIAC/CE) (GAAP) | 6.2% | ||||
| CE (GAAP) | 2,579 | ||||
| Exclude Average Intangible Assets (GAAP) | – 376 | ||||
| Average Tangible Common Equity (TCE) (non-GAAP) | 2,203 | ||||
| ROTCE (NIAC/TCE) (non-GAAP) | 7.2% | ||||
| NIAC (GAAP) | $ | 159 | |||
| Exclude notable items from NIAC | + 112 | ||||
| Adjusted NIAC (non-GAAP) | 271 | ||||
| TCE (non-GAAP) | 2,203 | ||||
| Exclude impact on TCE of notable items | – 49 | ||||
| Adjusted TCE (non-GAAP) | 2,154 | ||||
| Adjusted ROTCE (Adj NIAC/Adj TCE) (non-GAAP) | 12.6% | ||||
| * $ | in millions | ||||
| C-2 |
| APPENDIX C—RECONCILIATION OF NON-GAAP TO GAAP FINANCIAL INFORMATION |
| 2017 ADJUSTED EFFICIENCY RATIO |
| Item | Amount | * | |||
| Noninterest expense (Expenses) (GAAP) | $ | 1,024 | |||
| Revenues (gross income after loan loss provision) (GAAP) | 1,333 | ||||
| Efficiency ratio (Expenses/Revenues) (GAAP) | 77% | ||||
| Expenses (GAAP) | 1,024 | ||||
| Exclude notable items | – 112 | ||||
| Adjusted Expenses (non-GAAP) | 912 | ||||
| Revenues (GAAP) | 1,333 | ||||
| Adjusted Efficiency ratio (adj Expenses/Revenues) (non-GAAP) | 69% | ||||
| * $ | in millions | ||||
| C-3 |

![]()
ANNUAL MEETING
April 25, 201724, 2018
10:00 a.m. Central time
FIRST TENNESSEE BUILDINGFirst Tennessee First Ops BuildingM-Level Auditorium3451 Prescott Road165 Madison Avenue
Memphis, TN 3810338118
| PROXY SOLICITED ON BEHALF OF THE BOARD OF DIRECTORS AND VOTING INSTRUCTION CARD FOR |  |  |
| FIRST HORIZON NATIONAL CORPORATION SAVINGS PLAN (“Plan”) |
Shareholders of Record:The undersigned appoints George P. Lewis and Ben C. Adams, Jr., or any one or both of them with full power of substitution, as proxy or proxies, to represent and vote all shares of stock standing in my name on the books of the corporation at the close of business on February 24, 2017,23, 2018, which I would be entitled to vote if personally present at the annual meeting of shareholders of First Horizon National Corporation, to be held in the auditorium of the First Tennessee First Ops Building, 165 Madison Avenue,3451 Prescott Road, Memphis, Tennessee on April 25, 2017,38118, at 10 a.m. Central time, or any adjournments thereof, upon the matters set forth in the notice of said meeting as stated on the reverse side. The proxies are further authorized to vote in their discretion as to any other matters which may properly come before the meeting. The board of directors, at the time of preparation of the proxy statement, knows of no business to come before the meeting other than that referred to in the proxy statement.
Plan Shareholders:Under the terms of the Plan, each participant having funds allocated to the FHNC Stock Fund is entitled to instruct State Street Bank and Trust Company, plan trustee (“Plan Trustee”), as to the manner in which to vote the shares of First Horizon common stock held in the FHNC Stock Fund represented by the participant’s interest therein as of February 24, 201723, 2018 (the record date for the annual meeting of shareholders). The purpose of this instruction card is for the participant to give instructions to the Plan Trustee as to how to vote such shares in connection with the annual meeting of shareholders of First Horizon National Corporation to be held in the Auditorium of the First Tennessee First Ops Building, 165 Madison Avenue,3451 Prescott Road, Memphis, Tennessee 38118, on April 25, 2017,24, 2018, at 10 a.m. Central time, or any adjournments thereof, upon the matters set forth in the notice of said meeting as stated on the reverse side and also on any other matters that may properly come before the meeting. The undersigned hereby directs the Plan Trustee to vote the shares of FHNC common stock in the FHNC Stock Fund represented by the undersigned’s interest therein as specified on the reverse side.
THE SHARES COVERED BY THIS PROXY/VOTING INSTRUCTION CARD WILL BE VOTED IN ACCORDANCE WITH THE AUTOMATED TELEPHONE VOTING INSTRUCTIONS, THE INTERNET VOTING INSTRUCTIONS, OR THE INSTRUCTIONS GIVEN ON THE REVERSE SIDE. WHEN NO INSTRUCTIONS ARE GIVEN, SHARES HELD OF RECORD THAT ARE COVERED BY THIS CARD WILL BE VOTED, IN ACCORDANCE WITH THE RECOMMENDATIONS OF THE BOARD OF DIRECTORS,FORVOTE ITEMS 1, 2, 3 AND 4, AND, WITH RESPECT TO ITEM 3, FOR APPROVAL OF AN EVERY YEAR FREQUENCY FOR FUTURE VOTES ON AN ADVISORY VOTE ON EXECUTIVE COMPENSATION, AND SHARES HELD IN THE PLAN THAT ARE COVERED BY THIS CARD WILL BY VOTED BY THE PLAN TRUSTEE IN THE SAME PROPORTION AS ALL OTHER PLAN SHARES AS TO WHICH INSTRUCTIONS ARE RECEIVED BY THE PLAN TRUSTEE. ALL THE VOTE ITEMS ARE DESCRIBED IN THE ACCOMPANYING NOTICE OF ANNUAL MEETING AND PROXY STATEMENT AND ON THE REVERSE SIDE OF THIS CARD.
YOU CAN VOTE BY TELEPHONE, OVER THE INTERNET, OR BY SIGNING AND RETURNING THIS CARD AS DIRECTED ON THE REVERSE SIDE.
Vote by Internet, Telephone or Mail
There are three ways to vote. Internet or telephone voting is available 24 hours a day, 7 days a week.
Your phone or Internet vote authorizes the named proxies and/or the Plan Trustee to vote
your shares in the same manner as if you had marked, signed and returned this card.
You will need the last four digits of your Social Security or Tax ID number to vote your shares on the Internet or by phone.
  |  |  |   | ||
| INTERNET | TELEPHONE | Mark, sign and date this card and return it in the postage-paid envelope provided or mail to Shareowner Services, P.O. Box 64873, St. Paul, MN 55164-0873. | |||
| www.proxypush.com/fhn | 1-866-883-3382 | ||||
| Use the Internet to vote your shares until 11:59 p.m. (CT) on April 19, 2018 (for Plan shares) or April 23, 2018 (for all other shares). | Use any touch-tone telephone to vote your shares until 11:59 p.m. (CT) on April April |
If you vote by Internet or by telephone, you do NOT need to mail back this card.
| | Shareowner Services | ||
| P.O. Box 64945 | ||||
| St. Paul, MN 55164-0945 |
| Address Change? Mark box, sign, and indicate changes below:o | ||||
| TO VOTE BY INTERNET OR TELEPHONE, SEE REVERSE SIDE OF THIS CARD. | ||||
The Board of Directors unanimously recommends a vote FOR Items 1, 2, 3 and 4 and, with respect to Item 3, FOR approval of an EVERY YEAR frequency for future votes on an advisory resolution on executive compensation.4.
| 1. | Election of eleven directors to serve until the 2018 Annual Meeting of Shareholders: | ||||||||||||||
| FOR | AGAINST | ABSTAIN | FOR | AGAINST | ABSTAIN | ||||||||||
| 01 | John C. Compton | o | o | o | 07 | Vicki R. Palmer | o | o | o | ||||||
| 02 | Mark A. Emkes | o | o | o | 08 | Colin V. Reed | o | o | o | ||||||
 Please fold here – Do not separate Please fold here – Do not separate | |||||||||||||||
| 03 | Corydon J. Gilchrist | o | o | o | 09 | Cecelia D. Stewart | o | o | o | ||||||
| 04 | D. Bryan Jordan | o | o | o | 10 | Rajesh Subramaniam | o | o | o | ||||||
| 05 | R. Brad Martin | o | o | o | 11 | Luke Yancy III | o | o | o | ||||||
| 06 | Scott M. Niswonger | o | o | o | |||||||||||
| 2. | Approval of an advisory resolution to approve executive compensation | o | For | o | Against | o | Abstain | ||||||||
| 3. | Vote on an advisory resolution on the frequency (whether | ||||||||||||||
| every year, every two years or every three years) of future | Every | Every | Every | ||||||||||||
| votes on an advisory resolution on executive compensation | o | Year | o | 2 Years | o | 3 Years | o | Abstain | |||||||
| 4. | Ratification of appointment of KPMG LLP as auditors | o | For | o | Against | o | Abstain | ||||||||
| 1. | Election of twelve directors to serve until the 2019 Annual Meeting of Shareholders: |
| FOR | AGAINST | ABSTAIN | FOR | AGAINST | ABSTAIN | |||||
| 01 | John C. Compton | o | o | o | 07 | Vicki R. Palmer | o | o | o | |
| 02 | Mark A. Emkes | o | o | o | 08 | Colin V. Reed | o | o | o | |
 Please fold here – Do not separate Please fold here – Do not separate | ||||||||||
| 03 | Peter N. Foss | o | o | o | 09 | Cecelia D. Stewart | o | o | o | |
| 04 | Corydon J. Gilchrist | o | o | o | 10 | Rajesh Subramaniam | o | o | o | |
| 05 | D. Bryan Jordan | o | o | o | 11 | R. Eugene Taylor | o | o | o | |
| 06 | Scott M. Niswonger | o | o | o | 12 | Luke Yancy III | o | o | o | |
| 2. | Approval of technical amendments to modernize First Horizon’s Restated Charter | o | For | o | Against | o | Abstain |
| 3. | Approval of an advisory resolution to approve executive compensation | o | For | o | Against | o | Abstain |
| 4. | Ratification of appointment of KPMG LLP as auditors | o | For | o | Against | o | Abstain |
THE UNDERSIGNED HEREBY ACKNOWLEDGES RECEIPT OF NOTICE OF SAID MEETING AND THE RELATED PROXY STATEMENT.
Date _____________________________________, 2017
| Date | , 2018 |
| Signature(s) in Box | ||||
| Shareholders sign here exactly as shown on the imprint on this card. When signing as Attorney, Executor, Administrator, Trustee or Guardian, please give full name. If more than one Trustee, all should sign. All Joint Owners should sign. | ||||


